บทคัดย่อ
3D-DXA ซึ่งถูกนำมาใช้ในเครื่องมือซอฟต์แวร์ 3D-Shaper คือวิธีการทางซอฟต์แวร์ที่สร้างภาพจำลอง 3 มิติของ กระดูกต้นขาส่วนบน (proximal femur) จากภาพ DXA 2 มิติเพียงภาพเดียว โดยการลงทะเบียนโมเดลทางสถิติ การนำ 3D-DXA มาใช้มีจุดมุ่งหมายเพื่อ ให้ค่าประมาณของพารามิเตอร์กระดูกโปร่ง (trabecular), กระดูกเปลือกแข็ง (cortical) และโครงสร้าง ซึ่งคล้ายคลึงกับที่ได้จาก การตรวจเอกซเรย์คอมพิวเตอร์เชิงปริมาณ (QCT) ในฐานะผู้คิดค้นและพัฒนาวิธีการทางซอฟต์แวร์ที่เป็นรากฐานของ 3D-DXA ข้าพเจ้า ได้เฝ้าสังเกตการยอมรับและการใช้งานอย่างแพร่หลายด้วยความกังวลที่เพิ่มมากขึ้น บทความนี้ให้การประเมินเชิงวิพากษ์ เกี่ยวกับข้อจำกัดทางระเบียบวิธีที่มีอยู่ใน 3D-DXA และอภิปรายถึงผลกระทบต่องานวิจัยและการดูแลผู้ป่วย ปัญหาหลักคือการมองเห็นกระดูกเปลือกแข็งที่จำกัดในภาพ DXA ทำให้ 3D-DXA ไม่สามารถ หาค่าพารามิเตอร์ของกระดูกเปลือกแข็งได้อย่างแม่นยำ ซอฟต์แวร์จะอาศัยการทำนายโดยอิงจากค่าความหนาแน่นของมวลกระดูก (BMD) โดยรวมแทน การวัดค่าจากกระดูกเปลือกแข็งโดยตรง ซึ่งอาจนำไปสู่ผลลัพธ์ที่ไม่สะท้อนถึงการวัดค่ากระดูกเปลือกแข็งที่แท้จริง ข้อกังวลเพิ่มเติมรวมถึงความลำเอียงของประชากรเนื่องจากโมเดลทางสถิติถูกสร้างขึ้นจาก กลุ่มประชากรเฉพาะ และความแม่นยำในการสร้างภาพจำลองที่จำกัดจากการใช้ภาพ DXA เพียงมุมมองเดียว ข้อจำกัดเหล่านี้อาจส่งผลให้เกิดการวัดและผลการวิจัยที่ไม่ถูกต้อง ซึ่งส่วนใหญ่ ไม่ได้รับการตระหนักเนื่องจากการใช้ตัวชี้วัดการประเมินประสิทธิภาพที่ไม่เหมาะสม และการขาดการแก้ไขการเปรียบเทียบพหุคูณ ในการศึกษาที่เกี่ยวข้องกับ 3D-DXA แม้จะมีข้อจำกัดเหล่านี้ 3D-DXA ก็ได้รับการอนุมัติจากหน่วยงานกำกับดูแลในประเทศต่างๆ ซึ่งอาจส่งผลเสียต่อ ความแม่นยำในการวินิจฉัยทางคลินิกและการตัดสินใจในการรักษา โดยการชี้ให้เห็นถึงประเด็นเหล่านี้ บทความนี้มีจุดมุ่งหมายเพื่อ แจ้งให้แพทย์ นักวิจัย และหน่วยงานกำกับดูแลทราบถึงข้อจำกัดที่สำคัญของ 3D-DXA และเน้นย้ำถึง ความจำเป็นเร่งด่วนในการประเมินการใช้งานในงานวิจัยและทางคลินิกใหม่ เพื่อป้องกันการตีความผลลัพธ์ผิดพลาด และเพื่อความปลอดภัยของผู้ป่วยคำสำคัญ
3D-DXA, 3D-Shaper, การตรวจเอกซเรย์คอมพิวเตอร์เชิงปริมาณ (Quantitative Computed Tomography), ความหนาแน่นของมวลกระดูก (Bone Mineral Density), การดูดกลืนรังสีเอกซ์พลังงานคู่ (Dual-energy X-ray Absorptiometry), การทำแผนที่พารามิเตอร์ของกระดูกเปลือกแข็ง (Cortical Parameter Mapping), การวิเคราะห์โครงสร้างสะโพก (Hip Structure Analysis)บทสรุปสำหรับบุคคลทั่วไป
บททบทวนนี้ตรวจสอบซอฟต์แวร์ 3D-DXA หรือที่รู้จักกันในชื่อ 3D-Shaper อย่างมีวิจารณญาณ ซึ่งมีจุดมุ่งหมายเพื่อประมาณค่าพารามิเตอร์ของกระดูกโปร่ง กระดูกเปลือกแข็ง และโครงสร้างของกระดูกต้นขาส่วนบนจากภาพ DXA เพียงภาพเดียว 3D-DXA มีข้อจำกัดที่มีอยู่ หลายประการที่อาจนำไปสู่การวัดที่คลาดเคลื่อน ซึ่งอาจส่งผลกระทบต่อผลการวิจัยและการตัดสินใจในการรักษาผู้ป่วย การเข้าใจประเด็นเหล่านี้มีความสำคัญอย่างยิ่งสำหรับนักวิจัยและแพทย์ เพื่อหลีกเลี่ยงการตีความผิด ที่อาจส่งผลกระทบต่อความรู้ของเราเกี่ยวกับสรีรวิทยาของกระดูก ผลของการรักษาด้วยยา และความปลอดภัยของผู้ป่วยบทนำ
3D-DXA คือวิธีการทางซอฟต์แวร์ที่ลงทะเบียนโมเดลทางสถิติที่เปลี่ยนรูปได้ 3 มิติ ลงบนภาพ DXA 2 มิติเพียงภาพเดียว เพื่อสร้าง โมเดล 3 มิติของกระดูกต้นขาส่วนบน [1] โมเดลนี้สร้างขึ้นจากชุดข้อมูลการตรวจเอกซเรย์คอมพิวเตอร์ เชิงปริมาณ (QCT) ของประชากรชาวสเปนผิวขาวจำนวน 81 คนที่เป็นผู้หญิง และ 30 คนที่เป็นผู้ชาย โดยมีอายุเฉลี่ย 56.2 ± 12.1 ปี อยู่ในช่วงระหว่าง 30 ถึง 84 ปี [2] พารามิเตอร์ของโมเดลทางสถิติจะ อธิบายความแปรปรวนหลักของรูปร่างและการกระจายความตัวแน่นในประชากรกลุ่มนี้ ในกระบวนการทำซ้ำ พารามิเตอร์ของโมเดล รวมถึงตำแหน่ง การวางตัว และขนาด จะถูกค้นหาเพื่อให้ ภาพฉายของโมเดลมีความคล้ายคลึงกับภาพ DXA (รูปที่ 1) จากโมเดล 3 มิติที่ได้ พารามิเตอร์ของกระดูกเปลือกแข็งจะถูกวัดทั่วพื้นผิวกระดูก พร้อมกับค่า BMD เชิงปริมาตรของกระดูกโปร่งภายใน มีรายงาน ค่าความคลาดเคลื่อนสัมบูรณ์เฉลี่ย 0.33 มม. สำหรับความหนาของกระดูกเปลือกแข็ง และ 72 มก./ซม.³ สำหรับความหนาแน่นของกระดูกเปลือกแข็ง เมื่อเปรียบเทียบ 3D-DXA กับ QCT โดยมีค่าสัมประสิทธิ์สหสัมพันธ์มากกว่าหรือเท่ากับ 0.86 [2]
แม้ว่าจะมีการเสนอวิธีการอื่นๆ สำหรับการสร้างโครงสร้างกระดูก 3 มิติจากภาพ DXA โดยใช้ โมเดลทางสถิติ [4, 5] แต่วิธีการทางซอฟต์แวร์ที่ตีพิมพ์ครั้งแรกใน ปี 2010 [6] คือสิ่งที่ต่อมาได้รับการทำการค้าในชื่อ 3D-DXA โดย Galgo Medical SL (บาร์เซโลนา, สเปน) ซึ่งเป็น บริษัทแยกตัว (spin-off) ของมหาวิทยาลัยปอมเปว ฟาบรา (Pompeu Fabra University) (บาร์เซโลนา, สเปน) ซอฟต์แวร์นี้ต่อมาได้ขยายขีดความสามารถเพื่อวัด ความหนาของกระดูกเปลือกแข็งและความหนาแน่นของมวลกระดูก (BMD) ของกระดูกเปลือกแข็งจากการสร้างภาพจำลองเชิงปริมาตร [2] ซึ่งปัจจุบันมีการทำการค้าในชื่อ 3D-Shaper โดย 3D-Shaper Medical SL (บาร์เซโลนา, สเปน) ซึ่งเป็น บริษัทแยกตัวเพิ่มเติมของ Galgo Medical SL ที่ให้บริการทั้งบริการและซอฟต์แวร์ ซอฟต์แวร์นี้ได้รับอนุญาตให้แก่ DMS Imaging (Mauguio, ฝรั่งเศส) เพื่อจำหน่ายในชื่อ 3D-DXA พร้อมกับอุปกรณ์ Stratos/Medix DXA ของพวกเขา Fujifilm (โตเกียว, ญี่ปุ่น) ก็ จำหน่ายอุปกรณ์ DXA เดียวกันนี้ของ DMS ภายใต้แบรนด์ Fujifilm ชื่อ FDX Visionary DXA นอกจากนี้ Imex Medical (เซา โฮเซ, บราซิล) ก็จำหน่ายอุปกรณ์เหล่านี้ในชื่อซีรีส์ Elipse และ Radiología SA (มาดริด, สเปน) ก็จำหน่ายในชื่อ Radioscore - DR ซึ่งทั้งหมดนี้รวมถึงตัวเลือกในการเพิ่ม 3D-DXA
ในฐานะผู้พัฒนาวิธีการทางซอฟต์แวร์ดั้งเดิม [1] ข้าพเจ้ามีความเข้าใจอย่างลึกซึ้งถึง ข้อจำกัดที่มีอยู่ซึ่งอาจไม่ชัดเจนสำหรับผู้ใช้และนักวิจัยท่านอื่น แม้ว่าข้าพเจ้าจะได้อธิบายข้อจำกัดหลัก ของซอฟต์แวร์นี้ในจดหมายถึงบรรณาธิการของวารสาร Bone [7] แต่ 3D-DXA ก็ยังคงได้รับ การจำหน่ายและใช้งานทั่วโลก 3D-Shaper ได้รับการอนุมัติจากหน่วยงานกำกับดูแลในสหภาพยุโรป ญี่ปุ่น ไทย อาร์เจนตินา และการรับรอง 510(k) จาก FDA ซึ่งอนุญาตให้ใช้สำหรับการวินิจฉัยและตัดสินใจ การรักษาในผู้ป่วย เมื่อพิจารณาถึงการรับรองเหล่านี้ จึงเป็นเรื่องสำคัญและเร่งด่วนที่จะต้องจัดการและชี้แจง ความเข้าใจผิดบางประการเกี่ยวกับซอฟต์แวร์นี้ เพื่อเพิ่มความเข้าใจเกี่ยวกับข้อจำกัดของมัน
ข้อจำกัดทางระเบียบวิธี (Methodological limitations)
ในส่วนนี้ ข้าพเจ้าจะอธิบายข้อจำกัดบางประการของระเบียบวิธีที่เป็นพื้นฐานของ 3D-DXA รวมถึง รายละเอียดการใช้งานเฉพาะเจาะจงที่อาจส่งผลให้เกิดความคลาดเคลื่อนเพิ่มเติมพารามิเตอร์กระดูกเปลือกแข็งไม่ได้ถูกวัดจริง (Cortical parameters are not measured)
ปัญหาหลักอยู่ที่การขาดการมองเห็นกระดูกเปลือกแข็งในภาพ DXA สำหรับ 3D-DXA เพื่อที่จะหาค่าพารามิเตอร์ ของกระดูกเปลือกแข็ง เพื่อแสดงภาพนี้ ข้าพเจ้าขออ้างถึงรูปภาพจาก จดหมายถึงบรรณาธิการของวารสาร Bone (รูปที่ 2) ภาพ DXA แสดงให้เห็นอย่างชัดเจนว่าในตำแหน่งส่วนใหญ่ บนพื้นผิวกระดูก ไม่มีกระดูกเปลือกแข็งที่สังเกตเห็นได้ชัดเจนที่จะนำมาหาค่าพารามิเตอร์ สิ่งนี้ใช้ได้ กับขอบร่างของภาพฉายกระดูก (A) และเป็นจริงโดยเฉพาะอย่างยิ่งในที่ที่กระดูกเปลือกแข็งสองชิ้นที่อยู่ตรงข้ามกันตั้งฉาก กับตัวตรวจจับรังสีเอกซ์ (B) สิ่งนี้เห็นได้ชัดในภาพนี้จากเครื่องสแกน GE iDXA ที่มีขนาดพิกเซล 0.3 x 0.25 มม. แต่จะยิ่งชัดเจนขึ้นในภาพที่ใช้เครื่อง GE Prodigy DXA รุ่นเก่า ซึ่งให้ภาพที่มีความละเอียด ต่ำกว่ามากด้วยขนาดพิกเซล 0.6 x 1.05 มม. แต่ก็ได้รับการรองรับโดยซอฟต์แวร์ 3D-Shaper เช่นกัน
แทนที่จะวัดพารามิเตอร์ของกระดูกเปลือกแข็งโดยตรงจากภาพ DXA 3D-DXA จะลงทะเบียนโมเดลทางสถิติของ รูปร่างและการกระจายความหนาแน่นลงบนภาพ DXA [7] และสกัดพารามิเตอร์ของกระดูกเปลือกแข็ง จากโมเดลนี้ [2] โมเดลนี้สร้างขึ้นจากชุดข้อมูลการสแกน QCT ที่ผ่านการสอบเทียบ ซึ่งค่า Hounsfield unit ของวอกเซลในการสแกน CT มาตรฐานจะถูกแปลงเป็นค่า BMD โดยใช้แฟนทอมสำหรับการสอบเทียบ
ในการสร้างโมเดล กระดูกต้นขาส่วนบนในการสแกน QCT แต่ละครั้งจะถูกแบ่งส่วนก่อน ซึ่งหมายความว่าพื้นผิวเมช (surface mesh) ของ กระดูกต้นขาส่วนบนจะถูกสร้างขึ้น จากนั้นเทคนิคทางคณิตศาสตร์ เช่น การวิเคราะห์องค์ประกอบหลัก (Principal Component Analysis) จะถูกนำมาใช้กับ จุดของพื้นผิวกระดูกต้นขาที่จัดเรียงแล้ว ส่งผลให้ได้รูปร่างเฉลี่ยและชุดขององค์ประกอบหลัก (Principal Components - PCs) ที่อธิบายความแปรปรวนของรูปร่าง โดยเรียงลำดับตามความสำคัญ
ในการสร้างโมเดลทางสถิติของการกระจายความหนาแน่น ปริมาตร QCT จะถูกเปลี่ยนรูปให้ตรงกับรูปร่างเฉลี่ย และ วิธีการทางสถิติเดียวกันจะถูกนำมาใช้กับค่า BMD ในปริมาตร ทำให้เกิดปริมาตรเฉลี่ยและชุดของ PCs ที่อธิบายความแปรปรวนของความหนาแน่นของมวลกระดูกทั่วทั้งปริมาตร
องค์ประกอบหลักแต่ละตัวแสดงถึงลักษณะที่รูปร่างหรือความหนาแน่นของกระดูกสามารถแปรผันได้ (รูปที่ 3) พารามิเตอร์ของโมเดลคือปัจจัยตัวเลขที่กำหนดว่าปริมาณของ องค์ประกอบแต่ละตัวจะถูกเพิ่มเข้าไปในโมเดลเฉลี่ยมากน้อยเพียงใด การปรับพารามิเตอร์เหล่านี้จะปรับเปลี่ยนรูปร่างหรือการกระจายความหนาแน่น ทำให้เกิดอินสแตนซ์โมเดลใหม่ พารามิเตอร์จะถูกจำกัดให้อยู่ในช่วง 2.5 ถึง 3 ส่วนเบี่ยงเบนมาตรฐานของ ความแปรปรวนโดยทั่วไป เพื่อให้แน่ใจว่าโมเดลกระดูกจะดูสมจริงเสมอตามชุดของการสแกน QCT ที่มันถูกสร้างขึ้น มา ในการสร้างอินสแตนซ์ใหม่ของโมเดล ปริมาตรความหนาแน่นจะถูกเปลี่ยนรูปให้ตรงกับรูปร่างใหม่ โดยใช้การแปลงแบบ Thin Plate Splines (TPS) ที่คำนวณด้วยชุดย่อยของจุดรูปร่าง
ต่อจากนั้น 3D-DXA จะสร้างภาพจำลอง 3 มิติโดยการเปลี่ยนพารามิเตอร์ของโมเดลซ้ำๆ และสร้าง อินสแตนซ์โมเดลที่สอดคล้องกัน รวมถึงการหมุนและเลื่อนโมเดล จนกระทั่งภาพฉายของโมเดล ตรงกับภาพ DXA ตามเกณฑ์ตัวชี้วัดความคล้ายคลึงที่กำหนดไว้ล่วงหน้า (รูปที่ 1)
จากนั้นความหนาของกระดูกเปลือกแข็งและความหนาแน่นของกระดูกเปลือกแข็งจะถูกวัดจากอินสแตนซ์ของโมเดลโดยใช้วิธีการ ที่เทียบเท่ากับแนวทางการขจัดความเบลอ (deconvolution) ที่เสนอสำหรับ QCT [8] ดังนั้น พารามิเตอร์ของกระดูกเปลือกแข็ง จึงไม่ได้ถูกวัดจากภาพ DXA แต่มาจากโมเดลพารามิเตอร์ที่ถูกลงทะเบียนบนภาพนี้
ดังนั้น เมื่อแผนที่พารามิเตอร์ของกระดูกเปลือกแข็งถูกนำเสนอโดย 3D-DXA โดยมีค่าในตำแหน่งที่ไม่สามารถ วัดกระดูกเปลือกแข็งได้อย่างแน่นอน [9, 10, 11, 12, 13] แผนที่เหล่านี้จึงได้มาจากอินสแตนซ์ของโมเดลเท่านั้น แม้ว่า 3D-Shaper Medical จะชี้แจงในคำตอบต่อจดหมายถึงบรรณาธิการของวารสาร Bone [14] ว่าพารามิเตอร์เหล่านี้ เป็นการประมาณค่ามากกว่าการวัด แต่คำอธิบายที่แม่นยำกว่าคือ 3D-DXA ทำนายค่าเหล่านี้ โดยใช้วิธีการทางสถิติที่ซับซ้อนและอาจเกิดข้อผิดพลาดได้ง่าย เนื่องจากการมองเห็นกระดูกเปลือกแข็งที่จำกัดใน ภาพ DXA ซอฟต์แวร์จึงอาศัยความหนาแน่นของกระดูกโดยรวมเป็นหลักและถูกจำกัดโดยลักษณะทางสถิติ ของประชากรชาวสเปนที่เป็นฐานของโมเดล ผลกระทบในวงกว้างของข้อจำกัดนี้ จะถูกสำรวจเพิ่มเติมในบทวิจารณ์นี้
จำนวนพารามิเตอร์ของโมเดลที่ใช้ (Number of model parameters used)
ไม่มีพารามิเตอร์เดียวที่เพิ่มความหนาของกระดูกเปลือกแข็ง แต่การแสดงผลของกระดูกเปลือกแข็ง ขึ้นอยู่กับการรวมเชิงเส้นของปริมาตร 3 มิติเฉลี่ยและ PCs ของโมเดลความหนาแน่น ใน รูปที่ 4 เราสามารถเห็นตัวอย่างว่าค่าเฉลี่ยและ PCs สามรายการแรกสามารถสร้าง อินสแตนซ์โมเดลใหม่ได้อย่างไร ในตัวอย่างนี้ พารามิเตอร์ของโมเดล ซึ่งเป็นตัวคูณสำหรับ PCs มีค่าเท่ากับ 2, 3 และ -1.5 ตามลำดับ ในขณะที่ PC1 เพิ่มหรือลดความหนาแน่นในทุกที่ PCs อื่นๆ จะเปลี่ยน การกระจายความหนาแน่นในรูปแบบที่ไม่สามารถอธิบายได้ รูปนี้ยังแสดงให้เห็นว่าพารามิเตอร์ของกระดูกเปลือกแข็ง ถูกประมาณจากปริมาตรใหม่นี้โดยการปรับโมเดลขั้นบันไดให้เรียบได้อย่างไร การปรับเปลี่ยนความหนาของกระดูกเปลือกแข็ง ความหนาแน่นของกระดูกเปลือกแข็ง หรือความหนาแน่นของกระดูกโปร่งอย่างเจาะจงและเป็นอิสระต่อกัน หากทำได้ จะต้องใช้การรวมกันที่ซับซ้อนขององค์ประกอบหลักหลายรายการ และส่งผลให้ต้องใช้พารามิเตอร์ของโมเดลจำนวนมากโดยปกติแล้ว ชุดย่อยขององค์ประกอบหลักจะถูกเก็บไว้เพื่ออธิบายโหมดหลักของความแปรปรวน สิ่งนี้ช่วยลด ความแปรปรวนของการกระจาย BMD และจุดบนพื้นผิวให้เหลือเพียงชุดพารามิเตอร์ที่ลดลง โมเดลต้องใช้พารามิเตอร์จำนวนเท่าใด โดยทั่วไปจะกำหนดโดยการคำนวณจำนวนพารามิเตอร์ของโมเดลรูปร่างและความหนาแน่นที่อธิบาย 95% ของ ความแปรปรวนภายในประชากร หรือโดยการกำหนดจุด "ศอก" (elbow) ในกราฟความแปรปรวนสะสม อย่างไรก็ตาม วิธีที่แม่นยำกว่าคือการใช้ Horn's parallel analysis [6] ซึ่งประเมินทางคณิตศาสตร์ว่า PCs ใด ควรได้รับการพิจารณาว่าเป็นสัญญาณรบกวน (noise) และสามารถละทิ้งได้
แม้ว่าจำนวนพารามิเตอร์ที่ใช้จะเป็นองค์ประกอบที่สำคัญในแนวทางการสร้างโมเดลทางสถิติใดๆ แต่ตามความรู้ของข้าพเจ้า จำนวนนี้ หรือวิธีการที่ได้มาซึ่งจำนวนนี้ ไม่เคยได้รับการเปิดเผยโดย 3D-Shaper Medical หาก จำนวนพารามิเตอร์มีขนาดไม่เหมาะสมตามที่กำหนดโดย Horn's parallel analysis มันอาจจะไม่สามารถ เป็นตัวแทนของช่วงความแปรปรวนทั้งหมดในสัณฐานวิทยาของกระดูกต้นขาของประชากรที่นำเข้าได้อย่างถูกต้อง นอกจากนี้ หาก จำนวนพารามิเตอร์นี้ไม่เท่ากันในการใช้งานเพื่อการวิจัยและทางคลินิก จะเกิดความไม่เชื่อมโยงกันใน ความแม่นยำที่รายงานและความแม่นยำทางคลินิกของ 3D-DXA
ความลำเอียงของประชากรที่อาจเกิดขึ้น (Potential population bias)
โมเดลกระดูก 3 มิติใดๆ ที่สร้างโดย 3D-DXA นั้นได้มาจากสถิติเกี่ยวกับความแปรปรวนของประชากรที่นำเข้า ในกรณีของ 3D-Shaper โมเดลทางสถิติถูกสร้างขึ้นจากประชากรชาวสเปนจำนวน 81 คนที่เป็นผู้หญิง และ 30 คนที่เป็นผู้ชาย โดยมีอายุเฉลี่ย 56.2 ± 12.1 ปี [30 ปี – 84 ปี] [2] โดยไม่ได้รับการรักษาหรือมีโรคที่ส่งผลกระทบต่อเมแทบอลิซึมของกระดูก [15] เป็นที่ชัดเจนว่าสัณฐานวิทยาของกระดูกต้นขาระหว่างชายและหญิงมีความแตกต่างกัน แต่ ลักษณะทางประชากรศาสตร์ก็มีบทบาทสำคัญเช่นกัน ตัวอย่างเช่น กระดูกต้นขาของประชากรผิวขาวมีความแตกต่าง อย่างมีนัยสำคัญจากประชากรชาวเอเชีย ดังที่ได้บันทึกไว้ในการศึกษาก่อนหน้านี้ [16]โมเดลที่สร้างจากประชากรผิวขาวจะไม่สามารถสร้างภาพจำลองที่เหมาะสมกับทุกตัวแบบใน ประชากรชาวเอเชียได้ เนื่องจากพารามิเตอร์ของโมเดลทางสถิติถูกจำกัดให้อยู่ภายใน 3 ส่วนเบี่ยงเบนมาตรฐาน รอบโมเดลกระดูกต้นขาเฉลี่ยของประชากรชาวสเปน ตัวอย่างเช่น การศึกษาหนึ่งรายงานว่าผู้หญิงผิวขาวมี ความหนาของกระดูกเปลือกแข็งที่คอกระดูกต้นขา 1.84±0.03 มม. ในขณะที่ผู้หญิงเกาหลีอยู่ที่ 2.41±0.71 มม. ตามที่วัดได้จากการสแกน QCT [17] ดังนั้น ผู้หญิงเกาหลีที่มีความหนาของกระดูกเปลือกแข็งเฉลี่ย 2.41 มม. จะอยู่นอก ช่วงความแปรปรวนสำหรับประชากรผิวขาวเมื่อถูกจำกัดไว้ที่สามส่วนเบี่ยงเบนมาตรฐาน (1.75–1.93 มม.) ตัวอย่างนี้แสดงให้เห็นถึงความสำคัญของการให้โมเดลเป็นตัวแทนของประชากรเป้าหมาย
แม้ว่าการวัดด้วย 3D-DXA จะมีความสัมพันธ์กับ QCT ในประชากรญี่ปุ่น [18] แต่นี่เป็น เพียงเพราะพารามิเตอร์ทั้งหมดมีความสัมพันธ์กับ BMD เชิงพื้นที่ (areal BMD) ไม่ได้หมายความว่าได้ภาพจำลองที่เฉพาะเจาะจง กับผู้ป่วย โดยเฉพาะอย่างยิ่ง พารามิเตอร์ของกระดูกเปลือกแข็งที่ประมาณไว้อาจเบี่ยงเบนไปจากค่าจริงอย่างมาก โดยเฉพาะอย่างยิ่งเกี่ยวกับการกระจายเชิงพื้นที่ของพวกมัน แม้ว่ารูปร่างกระดูกต้นขาที่ทำนายไว้จะผิดพลาด แต่ค่าความหนาแน่น รวมถึงความหนาของกระดูกเปลือกแข็งและ BMD ของกระดูกเปลือกแข็ง จะยังคงสะท้อน aBMD ตราบใดที่ภาพฉายของ โมเดลทางสถิติทับซ้อนกับกระดูกในภาพ DXA เป็นส่วนใหญ่ บุคคลที่มี aBMD ต่ำจะมี vBMD ต่ำ BMD ของกระดูกเปลือกแข็งต่ำ และกระดูกเปลือกแข็งที่บางกว่าเมื่อเทียบกับผู้ป่วยที่มี aBMD สูงในประชากรใดๆ นอกจากนี้ [18] รายงานเพียงค่าความสัมพันธ์ และอาจมีความลำเอียงอย่างมีนัยสำคัญเมื่อใช้โมเดล ที่พัฒนาจากประชากรชาวสเปนกับประชากรชาวญี่ปุ่น ซึ่งอาจส่งผลที่ตามมาทางคลินิก แม้จะมี ข้อจำกัดพื้นฐานนี้ 3D-DXA ก็กำลังทำตลาดในเอเชีย รวมถึงประเทศต่างๆ เช่น ญี่ปุ่น ไทย และ อินเดีย
โมเดลทางสถิติจำเป็นต้องได้รับการฝึกฝนกับประชากรที่จะนำไปใช้ ซึ่งอาจหมายถึงการสร้างโมเดลแยกกัน สำหรับแต่ละเพศ ชาติพันธุ์ และอาจรวมถึงประเภทของการรักษา หรือโดยการรวมกลุ่มย่อยเหล่านี้ทั้งหมดไว้ในโมเดลเดียว โดยมีเงื่อนไขว่าต้องเก็บรักษาพารามิเตอร์ไว้เพียงพอที่จะจับช่วงความแปรปรวนทั้งหมด หลักการนี้เป็นที่ยอมรับ เป็นอย่างดีสำหรับเครื่องมือการเรียนรู้ของเครื่อง (machine learning) และปัญญาประดิษฐ์ [19, 20, 21, 22] แต่มีความสำคัญยิ่งกว่าสำหรับ แนวทางการสร้างโมเดลทางสถิติ ซึ่งโมเดลจะถูกจำกัดอย่างแข็งขันโดยประชากรที่นำเข้า อย่างไรก็ตาม 3D-DXA ได้ถูกนำมาใช้ในการศึกษาที่มีประชากรแตกต่างจากประชากรโมเดลอย่างเห็นได้ชัด ได้แก่: นักเต้นมืออาชีพ [9] นักฟุตบอลและนักว่ายน้ำ [23] ผู้หญิงอายุน้อยที่เป็นโรคอ้วน [24] ผู้หญิงผิวดำ [25] ผู้ป่วยที่มีมวลกระดูกสูง [11] ผู้ใหญ่ที่มีภาวะขาดฮอร์โมนการเจริญเติบโต [26] ผู้ป่วยโรคสะเก็ดเงิน [27] ผู้ป่วยเบาหวานชนิดที่ 2 [28] ผู้ป่วยภาวะต่อมพาราไทรอยด์ทำงานเกินแบบปฐมภูมิ [10, 29] ผู้ป่วยโรคอะโครเมกาลี (acromegaly) [30] ผู้ป่วยดาวน์ซินโดรม [13] ผู้ป่วยหลังการผ่าตัดตัดกระเพาะแบบสลีฟ (sleeve gastrectomy) [31] ผู้ชายที่บาดเจ็บไขสันหลัง [32] ชายวัยกลางคนและผู้สูงอายุชาวออสเตรเลียที่มีมวลกระดูกต่ำ [33] และที่น่ากังวลที่สุดคือ ผู้รอดชีวิตจากมะเร็งในเด็ก [34]
ความแม่นยำในการสร้างภาพจำลองที่จำกัด (Limited reconstruction accuracy)
3D-DXA เป็นวิธีการที่มีความซับซ้อนสูงและมีแนวโน้มที่จะเกิดข้อผิดพลาดในหลายขั้นตอน ซึ่งรวมถึงความไม่ถูกต้องจาก การสอบเทียบ QCT, การลงทะเบียนแบบเปลี่ยนรูปได้สำหรับการสร้างโมเดลทางสถิติ, การเปลี่ยนรูปของโมเดลความหนาแน่นไปยัง อินสแตนซ์รูปร่าง, ความคลาดเคลื่อนใน BMD และความละเอียดระหว่าง QCT และ DXA, และการลดทอนความซับซ้อนของภาพฉายโมเดลโดย ภาพฉายแบบไอโซเมตริกแทนภาพฉายแบบแฟนบีม (fan beam projection) ปัจจัยแต่ละอย่างเหล่านี้สามารถนำมาซึ่งความเบี่ยงเบนในรูปแบบที่คาดเดาไม่ได้ ซึ่งอาจทำให้ผลลัพธ์บิดเบือน นอกจากนี้ รายละเอียดการใช้งานเฉพาะเจาะจง เช่น การสร้าง โมเดลทางสถิติจากกลุ่มตัวอย่างขนาดเล็กมากของชาวสเปนผู้ใหญ่เพียง 111 คน (ซึ่งจำกัดความแปรปรวนในรูปร่าง ความหนาแน่น และความหนาของกระดูกเปลือกแข็ง) ยิ่งจำกัดความสามารถในการนำไปใช้ของเครื่องมือซอฟต์แวร์นี้นอกจากนี้ ยังไม่ชัดเจนว่า 3D-Shaper สามารถอ่านไฟล์ข้อมูลที่เป็นกรรมสิทธิ์ของเครื่อง GE และ Hologic ได้อย่างถูกต้องหรือไม่ โดยเฉพาะอย่างยิ่งเกี่ยวกับการใช้ปัจจัยการสอบเทียบและการแก้ไขที่ถูกต้องสำหรับองค์ประกอบของร่างกาย ที่แตกต่างกัน ความไม่ถูกต้องที่อาจเกิดขึ้นเหล่านี้อาจมีอิทธิพลต่อผลลัพธ์ของ 3D-Shaper เมื่อนำไปใช้กับประชากรที่แตกต่างกันหรือ เมื่อลักษณะของประชากรเปลี่ยนไปตามกาลเวลา
เป็นที่เข้าใจได้ว่า หากรูปร่างและการวางตัวของกระดูกต้นขาส่วนบนไม่ตรงกับภาพ DXA อย่างสมบูรณ์ ภายในความแม่นยำระดับต่ำกว่ามิลลิเมตร ก็ไม่น่าจะเป็นไปได้ที่จะสกัดความหนาของกระดูกเปลือกแข็งภายใน ความแม่นยำระดับต่ำกว่ามิลลิเมตร หรือความหนาแน่นของกระดูกเปลือกแข็งได้ น่าเสียดายที่มันเป็นไปไม่ได้ที่จะสร้างภาพจำลอง ที่สมบูรณ์แบบจากภาพ DXA 2 มิติเพียงภาพเดียว ดังที่การศึกษาในระยะแรกด้วย 3D-DXA ได้แสดงให้เห็นแล้ว [35] ในที่นี้แสดงให้เห็นว่าการเพิ่มมุมมองที่สองจะลดข้อผิดพลาดของรูปร่างจาก 1.3 มม. เป็น 0.9 มม. และข้อผิดพลาดของ BMD จาก 4.4% เป็น 3.2% ซึ่งบ่งชี้ถึงภาพจำลองที่ไม่เหมาะสมอย่างชัดเจนจากมุมมองเดียว ในทางตรงกันข้าม การตรวจเอกซเรย์คอมพิวเตอร์สร้างปริมาตรโดยใช้ภาพฉายหลายร้อยภาพที่ได้จากทุกมุมรอบกระดูกต้นขา ด้วยเหตุนี้ QCT จึงอนุญาตให้มีการวัดพารามิเตอร์ของกระดูกเปลือกแข็งและกระดูกโปร่งได้อย่างอิสระ
3D-DXA สามารถผลิตโมเดลกระดูกต้นขาที่มีสัณฐานวิทยาแตกต่างกันอย่างสิ้นเชิงขึ้นอยู่กับว่าการค้นหาพารามิเตอร์ของโมเดล ลู่เข้าที่ใด โดยเฉพาะอย่างยิ่งหากไม่กู้คืนการหมุนที่ถูกต้อง สิ่งนี้อาจแตกต่างกันอย่างมาก ดังที่เห็นได้จากการศึกษา โดยใช้ 3D-DXA ที่เกี่ยวข้องกับการสแกน DXA ซ้ำในวันเดียวกัน ซึ่งเปิดเผยความแตกต่างในการทำนายความแข็งแรงสูงถึง 62% [36] การศึกษานี้ยังรายงานความแตกต่างของ BMD แบบองค์ประกอบต่อองค์ประกอบ (element-by-element) ที่ถึง 30 ± 50% ซึ่ง น่าจะสะท้อนถึงความแม่นยำในการทำซ้ำที่ต่ำสำหรับพารามิเตอร์ของกระดูกเปลือกแข็งด้วยเช่นกัน แม้ว่าตัวเลขเหล่านี้จะไม่ ได้ถูกระบุไว้ ในการศึกษาแยกต่างหาก ความสัมพันธ์ระหว่างค่าความหนาแน่นของ 3D-Shaper และ QCT ก็ถูกรายงานว่า ต่ำ (r2 = 0.48) [37] ซึ่งยิ่งบ่งชี้ถึง ความแม่นยำในการสร้างภาพจำลองเฉพาะบุคคลที่จำกัด
ในการศึกษาเกี่ยวกับการวัดพารามิเตอร์โครงสร้างของกระดูกต้นขาโดยใช้ 3D-DXA มีรายงานค่าสัมประสิทธิ์สหสัมพันธ์ r = 0.86 สำหรับความยาวแกนคอกระดูกต้นขา [38] เมื่อหาความสัมพันธ์ระหว่างการวัดที่ได้มาจาก ปริมาตร 3D-DXA กับการวัดค่าความจริง (ground truth) จาก CT ซึ่งแย่กว่าเมื่อวัดโดยตรงใน ภาพ DXA (r = 0.90, [39]) นอกจากนี้ มุมคอกระดูกต้นขาเมื่อเทียบกับแท่งกระดูก (femoral neck shaft angles) ที่ผลิตโดย 3D-DXA ก็มี ความแม่นยำจำกัด (r = 0.71, [38]) เหตุผลที่ชัดเจนสำหรับการขาดความแม่นยำนี้ก็เพราะ หัวกระดูกต้นขาถูกแยกออกจากกระบวนการสร้างภาพจำลองโดยใช้หน้ากาก (mask) เพื่อป้องกันไม่ให้การทับซ้อนของกระดูกเชิงกรานครึ่งซีก (hemipelvis) มารบกวนการสร้างภาพจำลอง แม้ว่าสิ่งนี้จะสามารถแก้ไขได้โดยการเพิ่มโมเดลที่สองของกระดูกเชิงกรานครึ่งซีก เช่นใน [5]
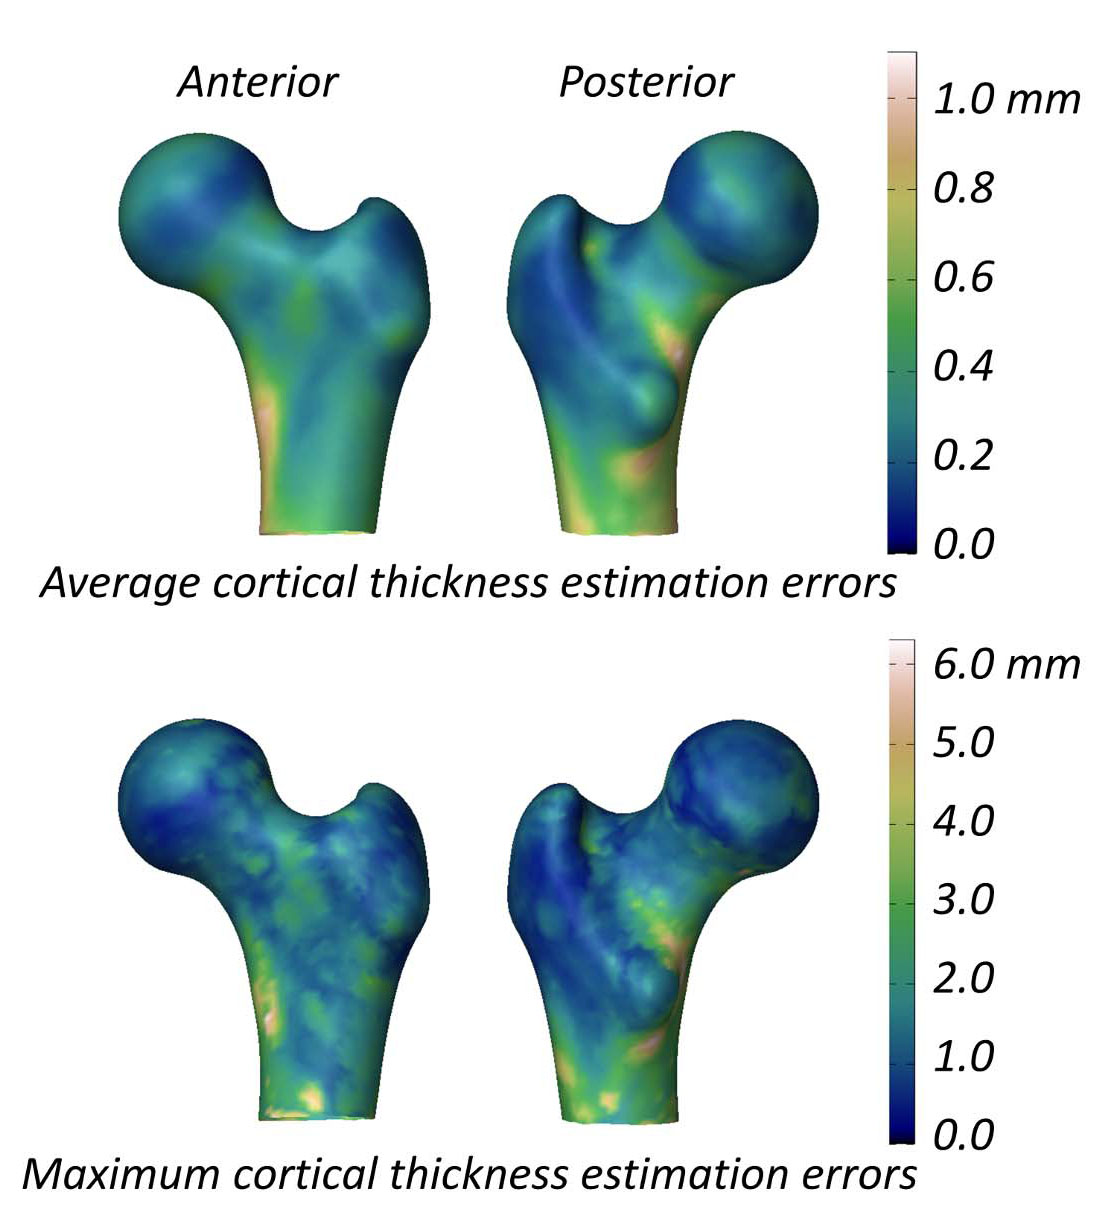
การศึกษาที่ประเมินความสามารถของ 3D-DXA ในการวัดพารามิเตอร์ของกระดูกเปลือกแข็งรายงานความแตกต่างของความหนา (mean ± standard deviation) ของกระดูกเปลือกแข็งระหว่าง 3D-DXA และ QCT คือ 0.04 ± 0.21 มม. ที่คอกระดูกต้นขา และ -0.07 ± 0.15 มม. ที่ โทรแคนเตอร์ (trochanter) [2] การศึกษานี้ยังนำเสนอรูปภาพที่แสดงค่าเฉลี่ยและค่าสูงสุดสัมบูรณ์ ของข้อผิดพลาดในการประมาณความหนาของกระดูกเปลือกแข็งทั่วพื้นผิวโมเดลกระดูกต้นขา (รูปที่ 5) โดยมีข้อผิดพลาดเฉลี่ยมากกว่า 0.2 มม. และข้อผิดพลาดสูงสุดมากกว่า 1 มม. ในพื้นที่ส่วนใหญ่ของพื้นผิวกระดูกต้นขา ในการเปรียบเทียบ การศึกษา QCT ที่วัด การเปลี่ยนแปลงความหนาของกระดูกเปลือกแข็งหลังการรักษาด้วยยา alendronate เป็นเวลา 18 เดือน รายงานการเพิ่มขึ้น 1.4% ซึ่งสอดคล้องกับ การเพิ่มขึ้นประมาณ 0.018 มม. ของความหนาของกระดูกเปลือกแข็ง [40] ข้อมูลที่รวบรวมจากการทดลองทางคลินิกสามรายการ เกี่ยวกับ teriparatide บ่งชี้ว่าความหนาของกระดูกเปลือกแข็งเพิ่มขึ้น 0.035 มม. [41] เมื่อพิจารณาว่าข้อผิดพลาดของ 3D-DXA นั้นเกินกว่าการเปลี่ยนแปลงทั่วไปที่เกิดจากการรักษานี้ การวัดด้วย 3D-DXA จึงไม่น่าจะ แยกแยะได้อย่างน่าเชื่อถือระหว่างผลกระทบที่เกิดจากการรักษาจริงและสัญญาณรบกวนทางระเบียบวิธี กล่าวอีกนัยหนึ่ง หาก กระดูกเปลือกแข็งของบุคคลดูเหมือนจะเปลี่ยนแปลง ก็ยังไม่ชัดเจนว่าสิ่งนี้เกิดขึ้นจากความเปลี่ยนแปลงทางสรีรวิทยาที่แท้จริง หรือจากข้อผิดพลาดในการวัดที่มีอยู่ใน 3D-DXA
ประโยชน์ที่จำกัดเหนือกว่า aBMD (Limited benefit over areal BMD)
ในโมเดลความหนาแน่นทางสถิติที่ 3D-DXA ใช้ พารามิเตอร์โมเดลแรกอธิบายความแปรปรวนส่วนใหญ่ และการเพิ่มค่าของมันจะนำไปสู่การเพิ่มขึ้นของทั้งความหนาแน่นโดยรวมและพารามิเตอร์ของกระดูกเปลือกแข็งทั้งหมด [7] เนื่องจากมีข้อมูลเพียงเล็กน้อยเกี่ยวกับกระดูกเปลือกแข็งในภาพ DXA 3D-DXA จึงอาศัย ความหนาแน่นโดยรวมเป็นหลัก และด้วยเหตุนี้จึงอาศัยพารามิเตอร์โมเดลแรกเป็นสำคัญ ผลที่ตามมาคือ พารามิเตอร์ของ กระดูกเปลือกแข็งและกระดูกโปร่งจึงมีความสัมพันธ์กันโดยเนื้อแท้ แม้ว่าอาจมีส่วนสนับสนุนจากกระดูกเปลือกแข็งด้านใน (inferior medial) และด้านข้าง (lateral) ของแท่งกระดูกที่มองเห็นได้ในภาพ DXA แต่พารามิเตอร์ที่ส่งกลับมาจาก 3D-DXA ส่วนใหญ่สะท้อนถึง BMD เชิงพื้นที่รวม (total areal BMD หรือ aBMD) ซึ่งหมายความว่าหาก aBMD เพิ่มขึ้น การวิเคราะห์ด้วย 3D-DXA จะแสดงการเพิ่มขึ้นพร้อมกันของ vBMD ของกระดูกโปร่ง, vBMD ของกระดูกเปลือกแข็ง และ ความหนาของกระดูกเปลือกแข็ง อันที่จริง การศึกษาล่าสุดที่นำเสนอในการประชุมสภาเนื้อเยื่อแคลเซียมยุโรป (European Calcified Tissue Society) ปี 2024 [42] และการประชุมประจำปีของสมาคมอเมริกันเพื่อการวิจัย กระดูกและแร่ธาตุ (American Society for Bone and Mineral Research) ปี 2024 [43] ยืนยันว่า พารามิเตอร์ของ 3D-Shaper มีความสัมพันธ์อย่างสูงกับ aBMD และดังนั้นจึงไม่ได้ให้ข้อมูลการทำนายการแตกหักเพิ่มเติมนอกจากนี้ แม้ว่าการสร้างภาพจำลอง 3D-DXA จะจับภาพร่างของกระดูกต้นขาโดยรวมที่มองเห็นได้ในภาพ DXA ความสามารถในการกู้คืนความยาวแกนคอและมุมคอกระดูกต้นขานั้นมีจำกัด ผลที่ตามมาคือ รูปร่างที่สร้างขึ้นใหม่ ส่วนใหญ่สะท้อนถึงขนาดกระดูกทั่วไป ซึ่งมีให้อยู่แล้วใน aBMD และไม่ได้ช่วยเพิ่มความสามารถในการทำนายความแข็งแรง ต่อการแตกหักมากนัก สิ่งที่แสดงให้เห็นถึงจุดนี้คือการค้นพบว่าการทำนายความแข็งแรงจาก 3D-DXA มีความสัมพันธ์กับ QCT (r2 = 0.88) แต่ไม่ได้ดีไปกว่าการทำนายโดยใช้เพียง aBMD ของคอกระดูกต้นขา จากภาพ DXA ทางสถิติ (r2 = 0.87) [37] การศึกษาโดย 3D-Shaper Medical แสดงความสัมพันธ์ที่คล้ายกัน (r2=0.86) แต่ความแตกต่าง กับ aBMD ถูกแยกออกไป [44] ในการศึกษาที่แตกต่างกันในประชากรญี่ปุ่น มาตรวัดจาก 3D-Shaper ไม่ได้ดีไปกว่า aBMD ของสะโพกรวมในการทำนายการแตกหักของสะโพกอย่างมีนัยสำคัญทางสถิติ [45]
ยังมีบทความอื่นๆ ที่ตีพิมพ์เกี่ยวกับวิธีการที่คล้ายคลึงกันในการลงทะเบียนโมเดลทางสถิติ 3 มิติบนภาพ DXA 2 มิติ และทำนายความแข็งแรงของกระดูกต้นขา [46, 47] โดยมีการศึกษาหนึ่งแสดง การปรับปรุงเหนือกว่า aBMD ในการทำนายความเสี่ยงของการแตกหัก [48, 49] วิธีนี้อาจมีข้อดีบางประการเหนือกว่า 3D-DXA เช่น การใช้โมเดลกระดูกเชิงกรานเพิ่มเติมเพื่อช่วยกู้คืนรูปร่างของ กระดูกต้นขาส่วนบนทั้งหมด แม้ว่าจะยังคงอยู่ภายใต้ข้อจำกัดทางระเบียบวิธีเดียวกันหลายประการ
หาก 3D-DXA ไม่สามารถทำงานได้ดีกว่า aBMD เพียงอย่างเดียว มันก็ย่อมไม่สามารถเหนือกว่าการรวมกันของ aBMD และพารามิเตอร์ HSA ซึ่งวัดได้โดยตรงจากภาพ DXA สิ่งนี้เน้นย้ำถึงข้อจำกัดพื้นฐานของ 3D-DXA และ ทำให้เกิดคำถามถึงความชอบธรรมในการนำไปใช้ในงานคลินิกหรือการวิจัย อย่างไรก็ตาม ปัจจุบัน 3D-Shaper Medical ได้ให้บริการวิเคราะห์ Finite Element บนพื้นฐานของ 3D-DXA เป็นการบริการ
วิธีการตรวจสอบความถูกต้อง (Methods of validation)
แม้จะมีข้อจำกัดที่มีอยู่ของ 3D-DXA แต่สิ่งตีพิมพ์จำนวนมากรายงานผลลัพธ์เชิงบวกเกี่ยวกับความแม่นยำของมัน ความแตกต่างนี้สามารถเกิดจากการใช้ระเบียบวิธีตรวจสอบความถูกต้องที่ไม่เหมาะสม [21, 22] ซึ่งมักจะบดบังข้อจำกัดที่แท้จริงของซอฟต์แวร์ ในส่วนต่อไปนี้ ข้าพเจ้าจะอภิปรายเกี่ยวกับ ประเด็นของการตรวจสอบความถูกต้องเหล่านี้ และวิธีที่พวกมันสร้างการรับรู้ถึงความน่าเชื่อถือและประโยชน์ทางคลินิก ของ 3D-DXAตัวชี้วัดการประเมินประสิทธิภาพที่ไม่ถูกต้อง (Wrong performance assessment metrics)
3D-Shaper Medical เปรียบเทียบพื้นผิวเมชที่สร้างโดย 3D-DXA จากภาพ DXA กับพื้นผิวเมชที่สร้างขึ้น ด้วยตนเองจากการสแกน QCT ของตัวแบบเดียวกัน ส่งผลให้ได้ระยะห่างจากจุดถึงพื้นผิวเฉลี่ย 0.93 มม. [2] พวกเขายังเปรียบเทียบพารามิเตอร์ของกระดูกเปลือกแข็ง โดยพบข้อผิดพลาดสัมบูรณ์เฉลี่ย 0.33 มม. สำหรับความหนาของกระดูกเปลือกแข็ง และ 72 มก./ซม.³ สำหรับความหนาแน่นของกระดูกเปลือกแข็ง อย่างไรก็ตาม ไม่มีกรอบการอ้างอิงที่จะกำหนดว่าข้อผิดพลาดที่รายงานเหล่านี้เป็นที่ยอมรับหรือไม่ ซึ่งหมายความว่าตัวชี้วัดเหล่านี้ ไม่ได้ตรวจสอบประสิทธิภาพของซอฟต์แวร์เสมอไปอีกวิธีหนึ่งที่ 3D-DXA ถูกประเมินคือการใช้ค่าความสัมพันธ์ (correlations) มีรายงานค่าสัมประสิทธิ์สหสัมพันธ์ที่ 0.86, 0.93, 0.95 และ 0.91 สำหรับ vBMD ของกระดูกโปร่ง, กระดูกเปลือกแข็ง และความหนาแน่นรวม (integral vBMD) รวมถึงความหนาของกระดูกเปลือกแข็งตามลำดับ อย่างไรก็ตาม ความสัมพันธ์ที่แข็งแกร่งเหล่านี้ส่วนใหญ่เกิดจากข้อเท็จจริงที่ว่า พารามิเตอร์ของกระดูกเปลือกแข็งทั้งหมดในทั้งโมเดล 3D-DXA และการสแกน QCT มีความสัมพันธ์อย่างมากกับความหนาแน่นโดยรวม ผู้ป่วยที่มี aBMD สูงกว่าค่าเฉลี่ยในการสแกน DXA โดยเฉลี่ยแล้วจะแสดงการเพิ่มขึ้นของ vBMD ของกระดูกโปร่ง, กระดูกเปลือกแข็ง และความหนาแน่นรวม พร้อมกับกระดูกเปลือกแข็งที่หนาขึ้น ผลลัพธ์ความสัมพันธ์เหล่านี้ไม่ได้ให้หลักฐานข้อสรุป ของความแม่นยำของซอฟต์แวร์ในการสร้างภาพจำลองเฉพาะบุคคล และในความเป็นจริง อาจสร้างความประทับใจที่เข้าใจผิดเกี่ยวกับประสิทธิภาพของมัน
ค่าความสัมพันธ์ยังถูกใช้เพื่อประเมินการศึกษาเชิงประชากรที่ใช้ 3D-DXA ผลกระทบที่คล้ายกันสามารถเห็นได้เมื่อ การวิเคราะห์ด้วย 3D-DXA แสดงความสัมพันธ์ที่มีนัยสำคัญระหว่างพารามิเตอร์และปัจจัยที่ทดสอบหรือในประชากรที่แตกต่างกัน นี่เป็นอีกครั้งเพราะพารามิเตอร์เหล่านี้มีความสัมพันธ์โดยเนื้อแท้กับ BMD โดยรวม และด้วยเหตุนี้จึงสะท้อนถึง การเปลี่ยนแปลงหรือความแตกต่างใน aBMD โดยตรง ผลการวิจัยอาจดูสมเหตุสมผลและสามารถสะท้อนการเปลี่ยนแปลงที่แท้จริงได้อย่างใกล้ชิด ตัวอย่างเช่น การออกกำลังกายช่วยเพิ่มทั้งความหนาแน่นโดยรวมและปริมาณแร่ธาตุในกระดูกเปลือกแข็ง [49] นำไปสู่ผลลัพธ์ที่ดูสมเหตุสมผลจากการวิเคราะห์ 3D-DXA เมื่อ aBMD เพิ่มขึ้นเนื่องจากการออกกำลังกาย อย่างไรก็ตาม สิ่งเหล่านี้ไม่ได้สะท้อนถึงพารามิเตอร์ของกระดูกเปลือกแข็งที่แท้จริง แต่เป็นเพียงการเปลี่ยนแปลงหรือความแตกต่าง ที่อยู่ภายใต้ aBMD เท่านั้น ดังนั้น การศึกษาเหล่านี้จึงสามารถสร้างความประทับใจที่เข้าใจผิดเกี่ยวกับประสิทธิภาพของ 3D-DXA ทำให้เกิดความรู้สึกที่ผิดว่ามันมีความสามารถในการวัดพารามิเตอร์ของกระดูกเปลือกแข็งได้อย่างแม่นยำ
การประเมินที่เหมาะสมกว่าจะเกี่ยวข้องกับการเปรียบเทียบพารามิเตอร์ของกระดูกเปลือกแข็งกับโมเดลพื้นฐานง่ายๆ เช่น โปรพริวเอสติเมเตอร์ (blind estimator) ในที่นี้ blind estimator หมายถึงวิธีการประมาณแบบง่ายๆ ที่ไม่ได้คำนึงถึง ความเป็นปัจเจกของตัวแบบ แต่ใช้ค่าเฉลี่ยจากประชากรทั้งหมดกับตัวแบบทุกตัวแทน ตัวอย่างเช่น blind estimator สำหรับ ความหนาของกระดูกเปลือกแข็งจะใช้แผนที่ความหนาเฉลี่ยจากกลุ่มบุคคลและนำไปใช้กับทุกกรณีอย่างสม่ำเสมอ โดยไม่คำนึงถึง ลักษณะเฉพาะของพวกเขา แนวทางนี้ทำหน้าที่เป็นเส้นฐาน (baseline) หรือมาตรฐานขั้นต่ำที่วิธีการขั้นสูงควรได้รับการประเมิน วิธีการที่ซับซ้อนใดๆ ควรสามารถทำผลงานได้ดีกว่าการประมาณขั้นพื้นฐานนี้เป็นอย่างน้อย ตามความรู้ของข้าพเจ้า การประเมินดังกล่าวไม่เคยได้รับการตีพิมพ์
สิ่งตีพิมพ์ส่วนใหญ่เกี่ยวกับซอฟต์แวร์ 3D-DXA มักจะแสดงเฉพาะการสร้างภาพจำลองที่ประสบความสำเร็จ ซึ่งอาจสร้าง ความมั่นใจที่ผิดพลาดในความน่าเชื่อถือของซอฟต์แวร์ เพื่อประเมินความน่าเชื่อถือของ 3D-DXA ในเชิงปริมาณ การประเมินอัตราความล้มเหลว (failure rate) สามารถทำได้ ในการศึกษาก่อนหน้านี้ [51] แม้ว่าจะไม่ได้ระบุไว้อย่างชัดเจน แต่มีเพียง 80 จาก 173 ตัวแบบเท่านั้นที่ถูกเก็บไว้หลังจากคัดออกเนื่องจากการสร้างภาพจำลอง ที่ถูกระบุว่าไม่ถูกต้องผ่านการเปรียบเทียบภาพฉายโมเดลกับภาพ DXA ซึ่งให้อัตราความล้มเหลวสูงถึง 50% เพื่อให้สามารถ ทำการประเมินดังกล่าวได้ 3D-Shaper จำเป็นต้องมีการแสดงการเปรียบเทียบเคียงข้างกันระหว่างภาพฉายโมเดลและภาพ DXA อย่างไรก็ตาม การประเมินที่แข็งแกร่งกว่าจะเปรียบเทียบภาพเรนเดอร์และภาพตัดขวางของปริมาตรที่ได้กับการสแกน QCT ซึ่งเป็นค่าความจริง และประเมินอัตราความล้มเหลวในการประเมินที่เป็นอิสระ
ในบางกรณี เพียงแค่สังเกตเห็นการเปลี่ยนแปลงหรือความแตกต่างที่มีนัยสำคัญก็ถูกนำเสนอเป็นหลักฐานว่า 3D-DXA ทำงานได้ โดยมองข้ามว่าผลกระทบที่แท้จริงนั้นถูกต้องหรือไม่ ในการตอบโต้จดหมายถึงบรรณาธิการของข้าพเจ้า มีการนำเสนอความแตกต่าง ที่มีนัยสำคัญระหว่างกลุ่มการรักษาเพื่อเป็นหลักฐานความมีประสิทธิภาพของ 3D-DXA อย่างไรก็ตาม ในการประเมินนี้ ผู้เขียนได้ให้ผลลัพธ์ที่แตกต่างกัน 2 แบบสำหรับการเปลี่ยนแปลง BMD ของกระดูกเปลือกแข็งหลังการรักษาด้วย TPTD แบบหนึ่งแสดงการเพิ่มขึ้นอย่างมีนัยสำคัญ [52] และอีกแบบแสดงการลดลงอย่างไม่มีนัยสำคัญ [15] ซึ่งทั้งสองอย่างนี้ไม่ได้สะท้อนถึงการเปลี่ยนแปลงที่แท้จริงที่ควรจะเกิดขึ้นในการรักษาด้วย TPTD ดังที่ข้าพเจ้าได้อธิบายไว้ในส่วน "ผลลัพธ์ที่ทำให้เข้าใจผิดในการศึกษาประสิทธิภาพของยา"
การขาดการแก้ไขการเปรียบเทียบพหุคูณ (Absence of multiple comparison correction)
ข้อกังวลในส่วนนี้ไม่ได้เกี่ยวข้องกับตัวซอฟต์แวร์ 3D-DXA เองเป็นหลัก แต่เกี่ยวข้องกับการบริการที่จัดหาโดย 3D-Shaper Medical และสิ่งตีพิมพ์ที่ตามมา ประเด็นสำคัญอยู่ที่การขาดการแก้ไขการเปรียบเทียบพหุคูณ เมื่อรายงานการเปลี่ยนแปลงหรือความแตกต่างในพารามิเตอร์ของ 3D-DXA โดยเฉพาะในแผนที่พารามิเตอร์ของกระดูกเปลือกแข็งการใช้การแก้ไขการเปรียบเทียบพหุคูณมีความสำคัญอย่างยิ่งเมื่อวิเคราะห์ข้อมูลที่มีการวัดค่าที่แตกต่างกันหลายค่า สำหรับ 3D-Shaper ซอฟต์แวร์จะสร้างพารามิเตอร์กระดูก 71 ค่า ซึ่งแต่ละค่าแสดงถึงการทดสอบทางสถิติที่แยกจากกัน หากไม่มีการปรับปรุงสำหรับการเปรียบเทียบพหุคูณเหล่านี้ เช่น การแก้ไขแบบ Bonferroni โอกาสที่จะได้รับผลลัพธ์ที่มีนัยสำคัญ โดยบังเอิญจะเพิ่มขึ้น นำไปสู่ข้อสรุปที่ผิดพลาด แม้จะเป็นเช่นนี้ การศึกษาที่ใช้ 3D-Shaper บ่อยครั้งมักรายงานการเปลี่ยนแปลง หรือความแตกต่างที่มีนัยสำคัญโดยไม่มีการใช้การแก้ไขการเปรียบเทียบพหุคูณรูปแบบใดๆ [10, 24, 27, 28] ซึ่งสร้างความรู้สึกมั่นใจที่ไม่อาจยืนยันได้ ในผลลัพธ์ สิ่งนี้อาจทำให้เข้าใจผิดเมื่อพารามิเตอร์บางอย่างถูกวัดแต่ไม่มีการรายงาน ซึ่งเป็นรูปแบบหนึ่งของอคติ p-hacking [53] ที่มีการเน้นย้ำถึงผลลัพธ์ที่มีนัยสำคัญในขณะที่เพิกเฉยต่อความเสี่ยงที่เพิ่มขึ้น ของผลบวกปลอม (false positives) เนื่องจากมีการทดสอบจำนวนมากที่ดำเนินการ
ปัญหาที่คล้ายกันเกิดขึ้นเมื่อการศึกษาที่ใช้ 3D-Shaper นำเสนอแผนที่รหัสสีที่แสดงการเปลี่ยนแปลงหรือความแตกต่างใน พารามิเตอร์ของกระดูกเปลือกแข็งบนพื้นผิวกระดูกหรือค่า BMD ในปริมาตร ในกรณีเหล่านี้ จุดยอด (vertex) หรือวอกเซลแต่ละจุด แสดงถึงการทดสอบทางสถิติแต่ละอย่าง โดยที่นัยสำคัญมักจะถูกกำหนดโดยการทดสอบ t-test ง่ายๆ ในแต่ละจุด [9, 10, 11, 12, 13, 28, 52, 54, 55] แนวทางนี้เน้นย้ำถึงภูมิภาคที่ดูเหมือนจะมีนัยสำคัญในแผนที่รหัสสี สร้างภาพลวงตาของ การเปลี่ยนแปลงหรือความแตกต่างที่เฉพาะเจาะจงในขณะที่ไม่มีการเปลี่ยนแปลงดังกล่าว เมื่อนำเสนอการเปลี่ยนแปลงหรือ ความแตกต่างในปริมาตรผ่านภาพตัดขวางรหัสสี นัยสำคัญทางสถิติในระดับวอกเซลโดยทั่วไปจะไม่ถูกระบุเลย [9, 11, 30, 52, 54, 55, 56] ในลักษณะเดียวกันนี้ สิ่งนี้ชี้ให้เห็นถึง การเปลี่ยนแปลงที่แท้จริง ทั้งที่ในความเป็นจริง สิ่งเหล่านี้อาจเป็นเพียงผลมาจากความแปรปรวนแบบสุ่ม ดังนั้น แผนที่รหัสสีเหล่านี้สามารถบ่งบอกถึงความประทับใจที่มองโลกในแง่ดีเกินไปเกี่ยวกับผลกระทบของการรักษาหรือการแทรกแซง ซึ่งระบุถึงประสิทธิภาพที่ผิดพลาด ทั้งที่อาจจะไม่มีอยู่จริง
ปัญหาเรื่องผลบวกปลอมเนื่องจากการแก้ไขการเปรียบเทียบพหุคูณที่ไม่เพียงพอเป็นความท้าทายที่ยาวนานในสาขาประสาทภาพ (neuroimaging) [57] เพื่อจัดการกับปัญหานี้ ชุมชนประสาทภาพได้พัฒนาแนวทางที่สามารถ นำไปใช้กับการศึกษาที่ตรวจสอบการเปลี่ยนแปลงของกระดูกเปลือกแข็งบนพื้นผิวกระดูกและการเปลี่ยนแปลงความหนาแน่น ในวอกเซลของการสแกน QCT ได้เช่นกัน Poole และคณะ [58] อธิบายว่า SurfStat (http://math.mccgill.ca/keith/surfstat/) สามารถนำมาใช้เพื่อทดสอบว่าความแตกต่างในพารามิเตอร์ของกระดูกเปลือกแข็ง ในแต่ละจุดบนพื้นผิวกระดูกนั้นมีนัยสำคัญทางสถิติหรือไม่ โดยใช้ทฤษฎีสนามสุ่ม (random field theory) สำหรับการแก้ไข การเปรียบเทียบพหุคูณ แพ็คเกจที่คล้ายกันมีอยู่สำหรับการวิเคราะห์ตามวอกเซล เช่น ไลบรารี Statistical Parametric Mapping (https://www.fil.ion.ucl.ac.uk/spm/) และ FMRIB Software Library (https://fsl.fmrib.ox.ac.uk) การใช้เครื่องมือเหล่านี้ จะช่วยปรับปรุงความเข้มงวดทางสถิติของการศึกษาที่ใช้ 3D-DXA แม้ว่าการเปลี่ยนแปลงหรือความแตกต่างที่สังเกตได้ จะยังคงสะท้อนถึงความสัมพันธ์ของพารามิเตอร์ทั้งหมดกับ aBMD เป็นส่วนใหญ่
ผลกระทบ (Implications)
การใช้ 3D-DXA มีผลกระทบในวงกว้างทั้งในงานวิจัยและการปฏิบัติทางคลินิก ส่วนต่อไปนี้จะเจาะลึกถึงความท้าทายเหล่านี้ผลลัพธ์ที่ทำให้เข้าใจผิดในการศึกษาประสิทธิภาพของยา (Misleading results in drug efficacy studies)
ในการศึกษาส่วนใหญ่ ผลลัพธ์ของ 3D-DXA จะสอดคล้องกับสิ่งที่คาดหวังในกระดูกเปลือกแข็ง เนื่องจากพารามิเตอร์ของ กระดูกเปลือกแข็งในคนที่มีสุขภาพดีมักจะมีความสัมพันธ์กับ aBMD สิ่งนี้มักจะนำไปสู่ผลลัพธ์ที่ดูสมเหตุสมผล อย่างไรก็ตาม แนวทางนี้มีความบกพร่องเมื่อการเปลี่ยนแปลงไม่ได้ดำเนินตามรูปแบบดั้งเดิม วิธีการนี้มีปัญหาโดยเฉพาะอย่างยิ่งใน การทดลองยาซึ่งกระบวนการสร้างและสลายกระดูกปกติ (bone modeling and remodeling) ถูกเปลี่ยนแปลง และการเพิ่มขึ้นหรือลดลง ตามสัดส่วนปกติในพารามิเตอร์ทั้งหมดอาจไม่เกิดขึ้นตัวอย่างที่แสดงให้เห็นคือการศึกษาเกี่ยวกับ teriparatide ซึ่ง 3D-DXA บ่งชี้ถึงการเพิ่มขึ้นของพารามิเตอร์ของ กระดูกเปลือกแข็งทั้งหมด รวมถึงการเพิ่มขึ้นอย่างมีนัยสำคัญของ vBMD ของกระดูกเปลือกแข็งเมื่อเทียบกับยาหลอก [52] ในทางตรงกันข้าม เมื่อใช้เทคนิคการวัดกระดูกเปลือกแข็งที่เทียบเท่ากันกับ QCT พบว่า BMD ของ กระดูกเปลือกแข็งลดลงอย่างมีนัยสำคัญภายหลังการรักษาด้วย teriparatide เป็นเวลา 18 เดือนแบบเดียวกัน ซึ่งเห็นได้ สม่ำเสมอในข้อมูลจากการทดลองทางคลินิกที่แตกต่างกันสามรายการ [41] การลดลงนี้มาจากอัตราของ การสลายกระดูกที่เพิ่มขึ้น ซึ่งส่งผลให้ความโปร่งของกระดูกเปลือกแข็ง (cortical porosity) สูงขึ้น ดังที่สังเกตได้ จากการใช้ micro-CT เช่นกัน [59]
ในการศึกษาก่อนหน้านี้ 3D-Shaper Medical ได้รายงานการลดลงของ BMD ของกระดูกเปลือกแข็งเพื่อตอบสนองต่อ teriparatide [15] แม้ว่าสิ่งนี้จะถูกผู้เขียนระบุว่าเป็นการลดลง แต่การเปลี่ยนแปลงนั้น ไม่มีนัยสำคัญทางสถิติ การศึกษาอิสระล่าสุดยังพบว่าไม่มีการเปลี่ยนแปลงที่มีนัยสำคัญใน BMD ของกระดูกเปลือกแข็ง เพื่อตอบสนองต่อการรักษาด้วย teriparatide โดยใช้การวิเคราะห์ 3D-DXA [60] อาจเป็นไปได้ว่า มีอิทธิพลบางประการจากกระดูกเปลือกแข็งของแท่งกระดูก ซึ่งมองเห็นได้บางส่วนในภาพ DXA เนื่องจากธรรมชาติของ 3D-DXA การลดลงของ aBMD ในภูมิภาคนี้อาจถูกฉายไปทั่วโมเดลกระดูกต้นขาทั้งหมด รวมถึงพื้นที่ที่มองไม่เห็นกระดูกเปลือกแข็ง เนื่องจากพารามิเตอร์ของโมเดลมีอิทธิพลต่อการกระจายความหนาแน่นไปทั่วโลก อย่างไรก็ตาม สิ่งนี้ไม่ได้นำไปสู่ผลลัพธ์ การลดลงอย่างมีนัยสำคัญของ BMD ในกระดูกเปลือกแข็งที่ถูกต้องตามที่สังเกตได้ในการศึกษา QCT
การศึกษาที่รายงานการเพิ่มขึ้นของพารามิเตอร์กระดูกเปลือกแข็งทั้งหมดด้วย teriparatide (TPTD) ยังได้ประเมิน abaloparatide ควบคู่ไปด้วย โดยแสดงให้เห็นการเพิ่มขึ้นที่มากขึ้นของพารามิเตอร์ทั้งหมดสำหรับสารหลัง [52] การศึกษาต่อเนื่องโดยใช้การวิเคราะห์ 3D-DXA ยังรายงานการเพิ่มขึ้นอย่างมีนัยสำคัญของ BMD ของกระดูกเปลือกแข็งหลังการรักษาด้วย abaloparatide [55, 56] เมื่อพิจารณาว่า abaloparatide มีกลไกการออกฤทธิ์ที่คล้ายคลึงกับ TPTD ในการส่งเสริมอัตราการสลายกระดูก ก็มีเหตุผลที่จะคาดหวังว่ามันจะนำไปสู่การลดลงของ BMD ในกระดูกเปลือกแข็งด้วยเช่นกัน อันที่จริง การศึกษาโดยใช้ QCT สังเกตเห็นการลดลงของ BMD ของกระดูกเปลือกแข็งหลังการรักษาด้วย abaloparatide ในช่วงเวลาที่ใกล้เคียงกันในผู้ป่วย 35 ราย [61] แม้ว่าการลดลงนั้นจะไม่มีนัยสำคัญทางสถิติ สิ่งนี้ชี้ให้เห็นว่าการศึกษาด้วย 3D-DXA ไม่เพียงแต่สร้างการเปลี่ยนแปลงที่ไม่ถูกต้อง แต่ยังน่าจะส่งผลให้การประเมินผลกระทบของ abaloparatide ดีเกินจริงอีกด้วย
การศึกษาโดย Lewiecki และคณะ [54] แสดงให้เห็นข้อจำกัดของ 3D-DXA เพิ่มเติมในการวัด พารามิเตอร์กระดูกเปลือกแข็งที่ขัดแย้งกัน การวิเคราะห์ 3D-DXA ของพวกเขารายงานการเพิ่มขึ้นของพารามิเตอร์ กระดูกเปลือกแข็งทั้งหมดเพื่อตอบสนองต่อ romosozumab ในทางตรงกันข้าม การวิเคราะห์ QCT ก่อนหน้านี้พบว่า ไม่มีการเพิ่มขึ้นของ BMD ของกระดูกเปลือกแข็งหลังการรักษาแบบเดียวกัน [62] ผู้เขียนระบุว่า “ยังไม่ชัดเจนว่าทำไมข้อมูลที่ได้จาก QCT และ 3D-SHAPER บนพื้นฐานของ DXA สำหรับการรักษาด้วย romosozumab ต่อ vBMD รวมของสะโพกและ vBMD ของกระดูกโปร่งจึงมีความคล้ายคลึงกันในทุกการศึกษา แต่กลับแตกต่างกันสำหรับ vBMD ของกระดูกเปลือกแข็ง” เมื่อพิจารณาว่าจดหมายถึงบรรณาธิการของวารสาร Bone ที่ผู้เขียนบางคนคนเดียวกันได้เห็นนั้นได้อธิบายและทำนาย ความคลาดเคลื่อนนี้ไว้แล้ว [7] ดูเหมือนว่าจะยังคงมีพฤติกรรมความเข้าใจผิดเกี่ยวกับความสามารถ และข้อจำกัดของ 3D-DXA และเป็นผลให้ความเข้าใจผิดนี้ยังคงนำไปสู่การประเมินประสิทธิภาพของยาที่มองโลกในแง่ดีเกินไปอีกครั้ง
การศึกษาเหล่านี้ยิ่งเผยแพร่ผลลัพธ์ที่อาจไม่ถูกต้องผ่านการนำเสนอแผนที่สีของการเปลี่ยนแปลงของกระดูกเปลือกแข็งและ กระดูกโปร่ง 3D-DXA ไม่สามารถวัดการเปลี่ยนแปลงที่มีจุดโฟกัสหรือการเปลี่ยนแปลงเฉพาะจุดได้ ส่วนหนึ่งก็เป็นเพราะ พารามิเตอร์ของโมเดลมีอิทธิพลต่อการกระจายความหนาแน่นไปทั่วโลก และส่วนหนึ่งก็เป็นเพราะการเปลี่ยนแปลงเหล่านี้ มองไม่เห็นในภาพ DXA การไม่ใช้การแก้ไขการเปรียบเทียบพหุคูณในการศึกษาเหล่านี้ยิ่งบั่นทอนผลลัพธ์ เนื่องจากภูมิภาค ที่ดูเหมือนจะมีนัยสำคัญในแผนที่นั้น ในความเป็นจริงมีความนัยสำคัญน้อยกว่ามาก นำไปสู่การประเมินยาประเภทต่างๆ ที่ดีเกินจริง
การจัดการผู้ป่วย (Patient management)
แม้ว่าซอฟต์แวร์ 3D-Shaper จะสามารถผลิตค่าการวัดได้ 71 ค่า แต่เวอร์ชันที่ได้รับการอนุมัติทางคลินิกจะผลิตเพียง ค่า vBMD ของกระดูกโปร่งทั่วโลก และ sBMD ของกระดูกเปลือกแข็ง รวมถึงค่า T-score และ Z-score ที่เกี่ยวข้อง ยังไม่ชัดเจนว่าค่า T- และ Z-score ได้มาจากประชากรกลุ่มใด แม้ว่าในการสัมมนาผ่านเว็บโดย 3D-Shaper Medical จะมีการบันทึกข้อมูลอ้างอิงของกลุ่มคนผิวขาวไว้ [63] แผนภูมิอ้างอิงเคยถูกสร้างขึ้นสำหรับประชากร ชาวสเปน [64] และประชากรชาวอาร์เจนตินา [65] ซึ่งทั้งสองถูกนำมาแสดงใน รูปที่ 6 แผนภูมิเหล่านี้มีความแตกต่างกันอย่างชัดเจนและแตกต่างจากตัวเลขที่สร้างโดย ซอฟต์แวร์ 3D-Shaper 3D-Shaper Medical, DMS Imaging และผู้จัดจำหน่ายของพวกเขาไม่ได้เปิดเผยข้อมูลประชากรนี้ หรือระบุว่าข้อมูลเหล่านี้ได้มาอย่างไร อย่างไรก็ตาม บริษัท โตโย เมดิก จำกัด (โตเกียว, ญี่ปุ่น) ผู้จัดจำหน่าย 3D-Shaper ในญี่ปุ่น ยืนยันว่าซอฟต์แวร์ 3D-Shaper ที่ได้รับการอนุมัติสำหรับตลาดญี่ปุ่นไม่ได้ใช้ข้อมูลอ้างอิงจากประชากรญี่ปุ่น เมื่อพิจารณาถึงความแตกต่างอย่างมากในพารามิเตอร์ของกระดูกเปลือกแข็งและกระดูกโปร่งระหว่างประชากรผิวขาวและประชากรเอเชีย [17] การใช้ค่า T- และ Z-score เหล่านี้ในญี่ปุ่นจึงดูเหมือนไม่มีความรอบคอบหากไม่มีการตรวจสอบ ความถูกต้องเพิ่มเติม ความถูกต้องของข้อมูลควรได้รับการยืนยันสำหรับประชากรทุกกลุ่มที่นำไปใช้งานแม้ว่าซอฟต์แวร์ 3D-Shaper หรือ 3D-DXA เพื่อการค้าจะไม่ได้ให้การตัดสินใจในการรักษาโดยอัตโนมัติ แต่วัสดุส่งเสริมการขาย แนะนำการใช้ตารางเพื่อช่วยแพทย์ในการตัดสินใจเลือกแนวทางการรักษาหลังจากการวิเคราะห์ด้วย 3D-DXA ตารางนี้ ซึ่งจำลองไว้ในตารางที่ 1 ให้สัญลักษณ์ (-, =, +, ++, +++) สำหรับการรักษาประเภทต่างๆ เพื่อแสดงลักษณะที่การรักษา ส่งผลกระทบต่อ vBMD ของกระดูกโปร่งหรือ sBMD ของกระดูกเปลือกแข็ง สัญลักษณ์เหล่านี้อิงตามเกณฑ์ (thresholds) ซึ่งระบุไว้ในตารางที่ 3 หากมีข้อมูล แม้ว่าค่าเกณฑ์จะค่อนข้างตามอำเภอใจหรือไม่ระบุชัดเจน แต่ตารางอาจมีความถูกต้อง ในภาพรวมจากความรู้ในการศึกษา QCT อย่างไรก็ตาม ข้อมูลเหล่านี้ได้รับการระบุว่ามาจากงานศึกษา 3D-DXA พร้อมการอ้างอิง ถึงการรักษาประเภทต่างๆ เนื่องจาก 3D-DXA มีประเด็นเฉพาะตัวเมื่อพารามิเตอร์ของกระดูกเปลือกแข็งไม่ได้เปลี่ยนแปลงไป ในแนวทางเดียวกับความหนาแน่นโดยรวม เช่น การรักษาด้วย teriparatide ข้าพเจ้าต้องการเน้นย้ำถึงผลกระทบที่ได้จากยาตัวนี้ ข้าพเจ้าได้ระบุสัญลักษณ์สำหรับการอ้างอิงแต่ละรายการที่จัดหาโดย 3D-Shaper Medical รวมถึงงานศึกษาอื่นที่ไม่ได้ถูกกล่าวถึง ไว้ในตารางที่ 2 ซึ่งค่าเหล่านี้มีความหลากหลายและแตกต่างจากสัญลักษณ์ที่ 3D-Shaper Medical จัดหาไว้ในตาราง ดังนั้น จึงไม่ชัดเจนว่าสัญลักษณ์เหล่านี้ได้มาอย่างไร ซึ่งทำให้เกิดคำถามถึงความสมเหตุสมผลของมันเมื่อใช้ร่วมกับ การวิเคราะห์ 3D-DXA
ในการสัมมนาผ่านเว็บ [66] 3D-Shaper Medical แนะนำความเป็นไปได้ในการใช้งานทางคลินิก ในกรณีที่ 3D-Shaper ส่งผลให้ sBMD ของกระดูกเปลือกแข็งต่ำและ vBMD ของกระดูกโปร่งต่ำมาก เนื่องจาก teriparatide ตามตารางนี้ จะช่วยปรับปรุงกระดูกโปร่งได้ดีกว่ากระดูกเปลือกแข็ง teriparatide จึงถูกระบุว่าเป็นแนวทางการรักษาที่ดีที่สุด อย่างไรก็ตาม ตามตารางนี้ แพทย์จะเลือกใช้ Denosumab หรือ Abaloparatide มากกว่า teribaratide ตามธรรมชาติ หากเพิกเฉยต่อความหนาแน่นของกระดูกสันหลัง (vertebral aBMD)
3D-DXA น่าจะถูกใช้งานควบคู่ไปกับการประเมิน T-score และ Z-score ของ DXA ทั่วไปเท่านั้น ดังนั้น ความเสี่ยงในการหลุด บุคคลที่มีความเสี่ยงสูงจึงมีน้อยมาก อย่างไรก็ตาม เนื่องจากข้อผิดพลาดที่เกี่ยวข้องกับ 3D-DXA ค่า sBMD ของกระดูกเปลือกแข็ง และ vBMD ของกระดูกโปร่งจะสูงขึ้นหรือต่ำลงเล็กน้อยอยู่เสมอ ในผู้ป่วยที่อยู่บนขอบของการรักษา สิ่งนี้อาจทำให้แพทย์เขวไป สู่การให้ยาต้านโรคกระดูกพรุนทั้งที่ไม่ได้มีการระบุความจำเป็นโดย aBMD เพียงอย่างเดียว
การศึกษาเกี่ยวกับคะแนนกระดูกโปร่ง (Trabecular Bone Score หรือ TBS) แสดงให้เห็นว่าการประเมินเพิ่มเติมนี้ มีอิทธิพลต่อการตัดสินใจในการรักษาอย่างมีนัยสำคัญในโรคกระดูกพรุนทุติยภูมิ [67] ในงานศึกษานั้น 21–25.5% ของผู้ป่วยที่มีการวัด BMD ปกติกลับมีคุณภาพกระดูกที่ไม่ดีตามที่ระบุโดย TBS ซึ่งส่งผลต่อการเปลี่ยน การตัดสินใจรักษา ผลกระทบในทำนองเดียวกันอาจเกิดขึ้นกับ 3D-DXA ซึ่งอาจนำไปสู่ผลลัพธ์ที่ไม่พึงประสงค์ เช่น การสั่งยาเกินความจำเป็น หากตารางถูกนำมาใช้ สิ่งนี้อาจโน้มน้าวแพทย์ให้เลือกยาตัวใดตัวหนึ่งมากกว่าอีกตัวหนึ่งเช่นกัน
นอกจากนี้ 3D-Shaper Medical ยังระบุด้วยว่าผู้ป่วยสามารถรับการติดตามผลเพื่อกำหนดว่าการรักษาที่เลือกนั้น มีผลกระทบตามที่คาดหวังต่อกระดูกเปลือกแข็งและกระดูกโปร่งจริงหรือไม่ อย่างไรก็ตาม เมื่อพิจารณาว่าข้อผิดพลาดของ 3D-DXA มีขนาดใหญ่กว่าการเปลี่ยนแปลงที่คาดหวัง และความสามารถในการทำซ้ำนั้นต่ำ [36] จึงไม่สามารถรับรองได้ว่าการเปลี่ยนแปลงที่เห็นในการประเมินติดตามผลด้วย 3D-DXA เกิดจากผลกระทบที่แท้จริง หรือเป็นเพียงข้อผิดพลาดที่มีอยู่ใน 3D-DXA หากแพทย์เชื่อมั่นในผลลัพธ์เหล่านี้ พวกเขาอาจเขวไปสู่ความต้องการ เปลี่ยนแปลงการรักษาอย่างไม่จำเป็น
ปัจจุบันซอฟต์แวร์ 3D-Shaper ยังได้รับใบอนุญาตจาก FDA ผ่านกระบวนการแจ้งเตือนก่อนวางตลาด 510(k) [68] 3D-Shaper Medical ได้รับสิ่งนี้โดยการใช้การศึกษาค่าความสัมพันธ์ที่เปรียบเทียบพื้นที่หน้าตัด (CSA), โมเมนต์ความเฉื่อยของหน้าตัด (CSMI), เซกชันโมดูลัส (Z), อัตราส่วนการโก่งตัว (Buckling Ratio หรือ BR), ความหนาแน่นของ แร่ธาตุในกระดูกพื้นผิวเปลือกแข็ง (sBMD), ความหนาแน่นของแร่ธาตุในกระดูกเชิงปริมาตรโปร่ง (vBMD) และความหนาแน่นรวมเชิงปริมาตร เข้ากับการวัดที่คล้ายกันจากซอฟต์แวร์ Hip Structural Analysis (HSA) โดยบริษัท Hologic จำกัด ซึ่งเคยได้รับใบอนุญาตจาก FDA มาก่อนแล้ว
เป็นที่น่าสังเกตว่า ความยาวแกนคอและมุมคอกระดูกต้นขาได้หายไปจากการประเมินนี้ และดังนั้นการใช้พารามิเตอร์เหล่านี้ จึงไม่ได้รับการอนุญาตจาก FDA ต้องระบุด้วยว่า แนวทางปฏิบัติของสมาคมระหว่างประเทศสำหรับการวัดความหนาแน่นของกระดูกทางคลินิก (ISCD) แนะนำว่าไม่ควรใช้พารามิเตอร์ HSA ในการประเมินความเสี่ยงของการแตกหักของสะโพก ยกเว้นความยาวแกนสะโพก [69] นอกจากนี้ การอนุมัติจากหน่วยงานกำกับดูแลนี้ไม่ได้รวมถึงค่า T-score หรือ Z-score เพื่อเปรียบเทียบการวัดกับข้อมูลอ้างอิง สิ่งนี้ก่อให้เกิดข้อกังวลเกี่ยวกับการใช้งานทางคลินิกของ 3D-Shaper ในสหรัฐอเมริกา
ในที่สุด พารามิเตอร์ของ 3D-Shaper ถูกพิจารณาว่ามีความเทียบเท่าอย่างมากกับตัวเลือก HSA สำหรับเครื่องวัดความหนาแน่น ของกระดูก Hologic QDR X-ray FDA ไม่สามารถยืนยันได้ว่า 3D-Shaper สามารถใช้กับเครื่องสแกน DXA อื่นๆ ได้หรือไม่ ทิ้งคำถามเกี่ยวกับความเข้ากันได้กับอุปกรณ์อื่นในสหรัฐอเมริกาไว้โดยที่ยังไม่มีข้อสรุป
บทวิจารณ์ (Discussion)
โดยสรุป 3D-DXA ผลิตพารามิเตอร์ของกระดูกที่หลากหลายซึ่งดูมีรายละเอียดสูง แต่โดยหลักแล้วสะท้อนถึง BMD เชิงพื้นที่ โดยรวมมากกว่าจะเป็นการวัดคุณสมบัติที่แยกจากกันของกระดูกเปลือกแข็งหรือกระดูกโปร่ง แม้ว่าซอฟต์แวร์อาจให้ผลลัพธ์ที่ มีความสัมพันธ์กับค่าที่แท้จริงในประชากรที่การเปลี่ยนแปลงของกระดูกเปลือกแข็งและกระดูกโปร่งเป็นสัดส่วนกับ aBMD แต่มันมีข้อบกพร่องในการจับค่าการวัดเฉพาะบุคคลหรือการเปลี่ยนแปลงเฉพาะจุด ข้อจำกัดนี้มีความชัดเจนเป็นพิเศษในสถานการณ์ เช่น การรักษาด้วยวิธี anabolic ซึ่งพารามิเตอร์ของกระดูกเปลือกแข็งและกระดูกโปร่งอาจเปลี่ยนแปลงในทางตรงกันข้ามกัน และ 3D-DXA ล้มเหลวที่จะสะท้อนการเปลี่ยนแปลงที่แท้จริงเหล่านี้ตามที่สังเกตได้จาก QCT สิ่งนี้ก่อให้เกิดข้อกังวล อย่างมีนัยสำคัญต่อการใช้งานในการดูแลทางคลินิกเป็นประจำหรือการเป็นเครื่องมือวิจัยที่น่าเชื่อถือเบื้องต้น 3D-DXA ถูกพัฒนาขึ้นเพื่อใช้ในการวินิจฉัยโรคกระดูกพรุนได้ดีขึ้นโดยการให้อัตราประมาณการของ vBMD รวม [70, 71] การไม่ได้พยายามประเมินส่วนแยกต่างหากของกระดูกเปลือกแข็งและ กระดูกโปร่ง vBMD รวมที่ผลิตโดย 3D-DXA อาจยังแสดงถึงค่าประมาณการที่สมเหตุสมผล ระเบียบวิธีนี้ได้ถูกขยายขีดความสามารถ ในภายหลังเพื่อพยายามปรับปรุงการประเมินความเสี่ยงของการแตกหักโดยการวิเคราะห์พารามิเตอร์ของโมเดลโดยตรง เนื่องจาก พารามิเตอร์เหล่านี้อธิบายสัณฐานวิทยาของโมเดลทางสถิติอย่างครบถ้วน [51, 72, 73, 74] อย่างไรก็ตาม ข้อจำกัดหลักของ 3D-DXA ดังที่แจกแจงไว้ใน บทวิจารณ์นี้ ยังคงอยู่และบั่นทอนความแม่นยำและความน่าเชื่อถือของมัน
งานศึกษาชิ้นนี้ถูกจำกัดโดยการขาดความโปร่งใสจากบริษัทต่างๆ ที่ทำการผลิต 3D-DXA เพื่อการค้า รวมถึง 3D-Shaper Medical, DMS Imaging และ Fujifilm เป็นผลให้บทความนี้อาศัยข้อมูลที่เปิดเผยต่อสาธารณะและประสบการณ์ส่วนตัวของข้าพเจ้าใน การพัฒนาระเบียบวิธีนี้ ข้าพเจ้าสนับสนุนให้ผู้อ่านขอคำชี้แจงจากบริษัทเหล่านี้หรือตัวแทนของพวกเขาเกี่ยวกับแง่มุม ต่างๆ ของ 3D-DXA และ 3D-Shaper ที่ยังไม่ได้เปิดเผย
การประเมินจากหน่วยงานวิชาชีพสามารถให้แนวทางที่มีค่าโดยการให้อิสระในการประเมินความถูกต้องของ 3D-DXA และสร้าง คำแนะนำอย่างเป็นทางการเกี่ยวกับการใช้งาน แม้ว่าการอัปเดตแนวทางปฏิบัติสำหรับ dual-energy X-ray absorptiometry โดยคณะทำงานระหว่างประเทศเพื่อแนวปฏิบัติที่ดีที่สุดของ DXA ระบุเกี่ยวกับ 3D-DXA ว่า "ต้องการหลักฐานเพิ่มเติมเพื่อ ให้คำแนะนำสำหรับการใช้งานเทคนิคการถ่ายภาพรูปแบบใหม่เหล่านี้ในการปฏิบัติทางคลินิก" [75] ข้าพเจ้าเชื่อว่าปัจจุบันมีหลักฐานเพียงพอที่จะเป็นพื้นฐานสำหรับคำแนะนำได้ และข้าพเจ้าหวังว่าบททบทวนนี้จะเป็นประโยชน์ในแง่นั้น
สรุปประเด็นคือ ด้วยข้อจำกัดพื้นฐานของ 3D-DXA การประเมินอย่างวิชาชีพของข้าพเจ้าคือ พารามิเตอร์ของกระดูกเปลือกแข็ง และกระดูกโปร่งที่จัดหาโดย 3D-DXA ไม่ควรนำไปใช้เพื่อจุดประสงค์ในการวิจัย และไม่เหมาะสมที่จะนำไปประยุกต์ใช้ใน งานคลินิก เช่น การวินิจฉัย การติดตามผล หรือการสนับสนุนการตัดสินใจในการรักษา
ส่วนร่วมของผู้เขียน (Author contributions)
TW มีส่วนร่วมในการกำหนดแนวคิด, การดูแลข้อมูล, การวิเคราะห์อย่างเป็นทางการ, การสืบสวน, ระเบียบวิธีวิจัย, ทรัพยากร, การจัดทำภาพประกอบ และการเขียนต้นฉบับแหล่งเงินทุน (Funding)
ไม่มีการรับเงินทุนสำหรับงานศึกษาชิ้นนี้การเข้าถึงข้อมูล (Data availability)
ข้อมูลทั้งหมดที่นำเสนอในบทความนี้สามารถขอได้จากผู้เขียนผลประโยชน์ทับซ้อน (Conflicts of interest)
ผู้เขียนเป็นผู้ร่วมประดิษฐ์สิทธิบัตรที่เกี่ยวข้องกับระเบียบวิธีซึ่งเป็นรากฐานของซอฟต์แวร์ 3D-DXA ผู้เขียนได้มีส่วนร่วม ในการอภิปรายเกี่ยวกับทรัพย์สินทางปัญญาและต้นกำเนิดของรหัสซอฟต์แวร์ 3D-DXA เชิงพาณิชย์, โมเดลทางสถิติ และวัสดุ ส่งเสริมการขาย ผู้เขียนไม่มีส่วนเกี่ยวข้องกับ 3D-Shaper Medical หรือบริษัทอื่นๆ ที่เกี่ยวข้องกับการแสวงหาผลประโยชน์ เชิงพาณิชย์จาก 3D-DXA และไม่ได้รับส่วนแบ่งผู้ถือหุ้น ค่าลิขสิทธิ์ หรือค่าตอบแทนทางการเงินอื่นใด ผู้เขียนเคยได้รับเชิญ เป็นวิทยากรให้กับ UCB ในเวทีการศึกษา และได้รับทุนสนับสนุนการวิจัยจาก Amgen Inc. และ Lilly มุมมองที่แสดงในบทความนี้ เป็นมุมมองของผู้เขียนแต่เพียงผู้เดียว และตั้งอยู่บนพื้นฐานของการประเมินระเบียบวิธีและหลักฐานทางวิทยาศาสตร์ที่มีอยู่อย่างวิพากษ์ While the 3D-Shaper software can produce 71 measures, the clinically approved version produces only the global trabecular vBMD and cortical sBMD as well as an associated T-score and Z-score. It is not clear from what population the T- and Z-score are derived, although in a webinar by 3D-Shaper Medical a Caucasian reference data is noted [63]. Reference plots have previously been produced for a Spanish [64] and ประชากรอาร์เจนตินา [65] ซึ่งทั้งคู่แสดงซ้ำใน รูปที่ 6 อย่างไรก็ตาม แผนภูมิเหล่านี้ดูเหมือนจะแตกต่างจากกันและกัน และแตกต่างจากรูปที่สร้างโดยซอฟต์แวร์ 3D-Shaper 3D-Shaper Medical, DMS Imaging และตัวแทนจำหน่ายไม่ได้เปิดเผยประชากรกลุ่มนี้หรือวิธีการได้มาของข้อมูลเหล่านี้ อย่างไรก็ตาม ได้รับการยืนยันโดย Toyo Medic Co., Ltd. (โตเกียว ประเทศญี่ปุ่น) ตัวแทนจำหน่าย 3D-Shaper ในญี่ปุ่นว่าซอฟต์แวร์ 3D-Shaper ที่ได้รับอนุมัติสำหรับตลาดญี่ปุ่นไม่ได้ใช้ข้อมูลอ้างอิงจากประชากรญี่ปุ่น เมื่อพิจารณาถึงความแตกต่างอย่างมากในพารามิเตอร์คอร์เทกซ์และทราเบคิวลาร์ระหว่างประชากรคอเคเชียนและเอเชีย [68] การใช้ T-score และ Z-score เหล่านี้ในญี่ปุ่นจึงดูไม่รอบคอบนักหากไม่มีการตรวจสอบเพิ่มเติม ความถูกต้องของข้อมูลเหล่านี้ควรได้รับการยืนยันสำหรับทุกประชากรที่มีการนำไปใช้ด้วยเช่นกัน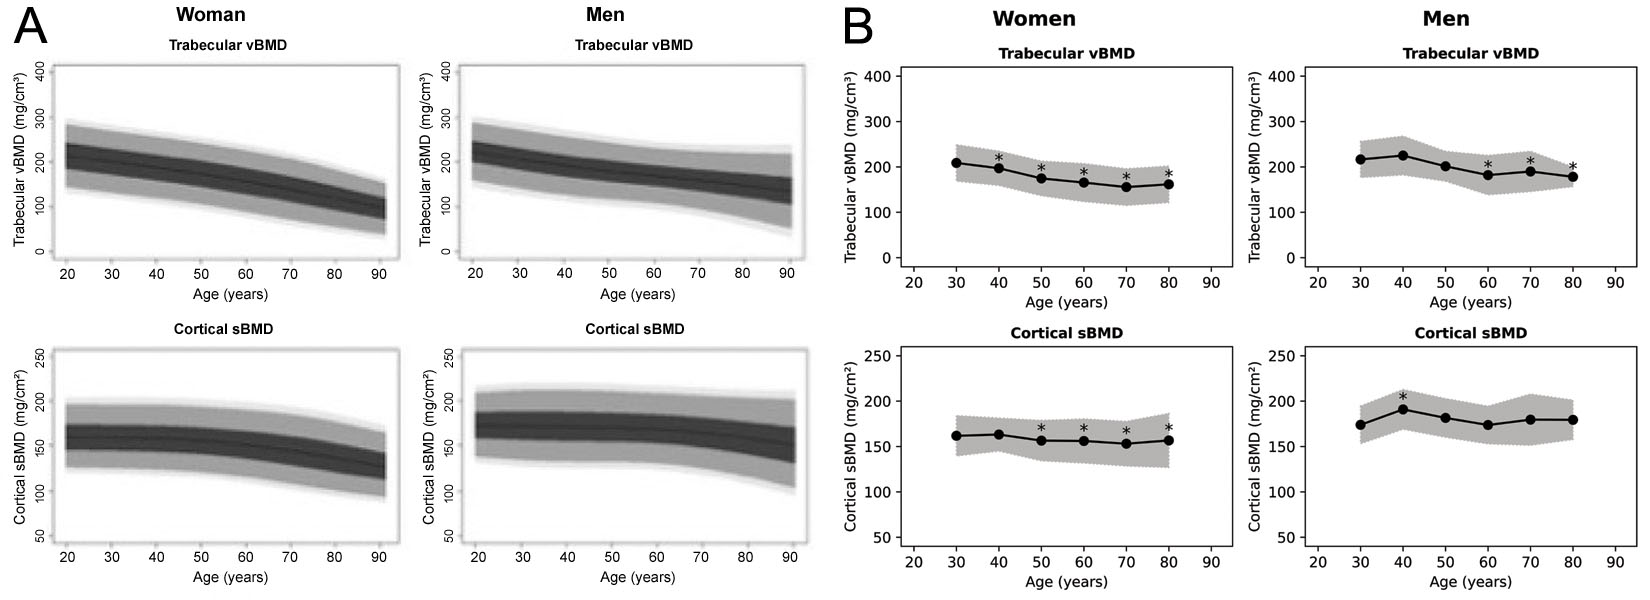
ในการสัมมนาผ่านเว็บ [66] 3D-Shaper Medical ได้เสนอแนะการใช้งานทางคลินิกที่อาจเกิดขึ้น โดยที่ 3D-Shaper ให้ผลลัพธ์เป็น sBMD ของคอร์เทกซ์ต่ำและ vBMD ของทราเบคิวลาร์ต่ำมาก เนื่องจากเทริพาราไทด์ตามตาราง ระบุว่าช่วยปรับปรุงกระดูกทราเบคิวลาร์ได้ดีกว่ากระดูกคอร์เทกซ์ จึงมีการกล่าวว่าเทริพาราไทด์เป็นการรักษาที่ดีที่สุด อย่างไรก็ตาม ตามตารางนี้ แพทย์จะเลือกใช้ Denosumab หรือ Abaloparatide มากกว่าเทริพาราไทด์โดยธรรมชาติหากไม่ได้คำนึงถึง aBMD ของกระดูกสันหลัง
3D-DXA มักจะถูกใช้ร่วมกับการประเมิน T-score และ Z-score ของ DXA ปกติเท่านั้น ดังนั้นอันตรายจากการพลาดบุคคลที่มีความเสี่ยงสูงจึงจะมีน้อยมาก อย่างไรก็ตาม เนื่องจากข้อผิดพลาดที่เกี่ยวข้องกับ 3D-DXA ค่า sBMD ของคอร์เทกซ์และ vBMD ของทราเบคิวลาร์จะสูงหรือต่ำกว่าความเป็นจริงเล็กน้อยเสมอ ในผู้ป่วยที่มีค่าอยู่ในเกณฑ์ก้ำกึ่งในการรักษา สิ่งนี้อาจโน้มน้าวให้แพทย์สั่งยาต้านโรคกระดูกพรุนในกรณีที่ aBMD เพียงอย่างเดียวไม่ได้ระบุว่าจำเป็นต้องใช้
การศึกษาเกี่ยวกับ Trabecular Bone Score (TBS) แสดงให้เห็นว่าการประเมินเพิ่มเติมนี้มีอิทธิพลอย่างมากต่อการตัดสินใจรักษาในโรคกระดูกพรุนทุติยภูมิ [67] ในการศึกษานั้น 21–25.5% ของผู้ป่วยที่มีการวัด BMD ที่ไม่ผิดปกติ มีคุณภาพกระดูกที่แย่ซึ่งระบุโดย TBS ซึ่งเปลี่ยนการตัดสินใจรักษา ผลกระทบที่คล้ายคลึงกันอาจเกิดขึ้นกับ 3D-DXA ซึ่งอาจนำไปสู่ผลที่ตามมาโดยไม่ตั้งใจ เช่น การสั่งยาเกินความจำเป็น หากมีการใช้ตารางนี้ อาจโน้มน้าวให้แพทย์เลือกใช้ยาตัวหนึ่งมากกว่าอีกตัวหนึ่งด้วย
นอกจากนี้ 3D-Shaper Medical ยังระบุด้วยว่าสามารถติดตามอาการผู้ป่วยเพื่อพิจารณาว่าการรักษาที่เลือกส่งผลต่อชั้นคอร์เทกซ์และทราเบคิวลาร์ตามที่คาดไว้หรือไม่ อย่างไรก็ตาม เมื่อพิจารณาว่าข้อผิดพลาดของ 3D-DXA นั้นมากกว่าการเปลี่ยนแปลงที่คาดไว้ และความสามารถในการวัดซ้ำนั้นต่ำ [36] จึงไม่สามารถยืนยันได้ว่าการเปลี่ยนแปลงที่เห็นในการประเมิน 3D-DXA ติดตามผลนั้นเกิดจากผลลัพธ์ที่เกิดขึ้นจริงหรือเพียงแค่ข้อผิดพลาดในตัวของ 3D-DXA หากแพทย์เชื่อมั่นในผลลัพธ์เหล่านี้ ก็อาจถูกโน้มน้าวให้เปลี่ยนการรักษาโดยไม่จำเป็น
(A)
| 2D DXA (กระดูกสะโพกโดยรวม) aBMD | 3D-DXA (3D-Shaper) vBMD ของกระดูกทราเบคิวลาร์ | 3D-DXA (3D-Shaper) sBMD ของกระดูกคอร์เทกซ์ | |
|---|---|---|---|
| Alendronate | + | + | + |
| Denosumab | ++ | ++ | ++ |
| Zoledronic acid | + | + | ++ |
| เทริพาราไทด์ (Teriparatide) [15, 52, 55*, 56] | + | ++ | = |
| Abaloparatide | ++ | ++ | ++ |
| Romosozumab | +++ | +++ | +++ |
(B)
| aBMD | vBMD | sBMD | |
|---|---|---|---|
| เทริพาราไทด์ (Teriparatide) [52, 56] (18 เดือน) | ++ (3.3%) | ++/+++ (9%) | + (1.8%) |
| เทริพาราไทด์ (Teriparatide) [15] (24 เดือน) | = (p > 0.05) | ++/+++ (5.9%) | = (p > 0.05) |
| เทริพาราไทด์ (Teriparatide) [60] (24 เดือน) | = (p > 0.05) | ++/+++ (>14%) | = (p > 0.05) |
(C)
| สัญลักษณ์ | (กระดูกสะโพกโดยรวม) aBMD | vBMD ของกระดูกทราเบคิวลาร์ | sBMD ของกระดูกคอร์เทกซ์ |
|---|---|---|---|
| +++ | Δ > n/a % | Δ > n/a % | Δ > n/a % |
| ++ | 2 < Δ ≤ n/a % | 4 < Δ ≤ n/a % | 2 < Δ ≤ n/a % |
| + | 0.5 < Δ ≤ 2 % | 0.5 < Δ ≤ 4 % | 0.5 < Δ ≤ 2 % |
| = | -0.5 ≤ Δ ≤ 0.5 % | -0.5 ≤ Δ ≤ 0.5 % | -0.5 ≤ Δ ≤ 0.5 % |
| - | -2 ≤ Δ < -0.5 % | -4 ≤ Δ < -0.5 % | -2 ≤ Δ < -0.5 % |
| -- | Δ < -2 % | Δ < -4 % | Δ < -2 % |
แม้ว่าซอฟต์แวร์ 3D-DXA เวอร์ชันที่ใช้ในทางคลินิกจะไม่ได้ระบุข้อมูลเกี่ยวกับ sBMD ของกระดูกคอร์เทกซ์ในบริเวณทางกายวิภาคต่างๆ แต่ซอฟต์แวร์จะแสดงแบบจำลอง 3 มิติที่รหัสสีค่า sBMD ทั่วพื้นผิวกระดูก 3D-Shaper Medical ได้เสนอแนะเพิ่มเติมว่าสิ่งนี้สามารถใช้เพื่อตรวจหาความเปราะบางเฉพาะจุดได้ [66] น่าเสียดายที่ 3D-DXA ไม่สามารถสร้างแผนที่คอร์เทกซ์ที่จำเพาะสำหรับผู้ป่วยแต่ละรายได้ ผมขออ้างถึงรูปที่ 2 อีกครั้งเพื่อคำอธิบายที่เข้าใจง่ายสำหรับเรื่องนี้ ดังนั้น หากแผนที่คอร์เทกซ์ของ 3D-DXA บ่งชี้ถึงความพร่องเฉพาะจุด สิ่งนี้อาจเป็นผลลัพธ์ของแบบจำลองที่ดูมีความเป็นไปได้ทางสถิติ แต่ไม่ตรงกับกายวิภาคศาสตร์ตามจริงของผู้ป่วย ซึ่งอาจนำไปสู่การตัดสินใจรักษาที่ไม่จำเป็นหรือไม่เหมาะสมได้
ปัจจุบันซอฟต์แวร์ 3D-Shaper ยังได้รับใบอนุญาตจาก FDA ผ่านกระบวนการแจ้งเตือนก่อนวางจำหน่าย 510(k) [68] โดย 3D-Shaper Medical ได้รับใบอนุญาตนี้โดยใช้การศึกษาความสัมพันธ์เพื่อเปรียบเทียบพื้นที่หน้าตัด (CSA), โมเมนต์ความเฉื่อยของหน้าตัด (CSMI), มอดุรัสของหน้าตัด (Z), อัตราส่วนการโก่งตัว (Buckling Ratio - BR), ความหนาแน่นของแร่ธาตุในกระดูกบริเวณพื้นผิวคอร์เทกซ์ (sBMD), ความหนาแน่นของแร่ธาตุในกระดูกทราเบคิวลาร์เชิงปริมาตร (vBMD) และ integral vBMD กับการวัดที่คล้ายกันจากซอฟต์แวร์ Hip Structural Analysis (HSA) โดย Hologic Inc. ซึ่งเคยได้รับใบอนุญาตจาก FDA มาก่อนหน้านี้
ที่น่าสังเกตคือ ความยาวแนวแกนคอ (neck axis length) และมุมแกนคอ (neck shaft angle) ยังคงไม่อยู่ในการประเมินนี้ ดังนั้นการใช้พารามิเตอร์เหล่านี้จึงไม่ได้รับใบอนุญาตจาก FDA นอกจากนี้ ควรสังเกตว่าแนวทางปฏิบัติของ International Society for Clinical Densitometry (ISCD) แนะนำว่าไม่ควรใช้พารามิเตอร์ HSA เพื่อประเมินความเสี่ยงต่อการแตกหักของสะโพก ยกเว้นความยาวแนวแกนสะโพก [69] ยิ่งไปกว่านั้น การรับรองตามระเบียบข้อบังคับนี้ไม่รวมถึง T-score หรือ Z-score เพื่อเปรียบเทียบการวัดกับข้อมูลอ้างอิง สิ่งนี้ทำให้เกิดความกังวลเกี่ยวกับการประยุกต์ใช้ 3D-Shaper ในทางคลินิกในสหรัฐอเมริกา
สุดท้ายนี้ พารามิเตอร์ของ 3D-Shaper ถือว่าเทียบเท่ากับตัวเลือก HSA สำหรับเครื่องวัดความหนาแน่นของกระดูกด้วยรังสีเอกซ์ Hologic QDR โดยพื้นฐาน อย่างไรก็ตาม FDA ไม่สามารถยืนยันได้ว่า 3D-Shaper สามารถใช้กับเครื่องสแกน DXA อื่นๆ ได้หรือไม่ ทำให้คำถามเรื่องความเข้ากันได้กับอุปกรณ์อื่นๆ ในสหรัฐอเมริกายังคงไม่มีคำตอบ
การอภิปราย
โดยสรุป 3D-DXA สร้างพารามิเตอร์กระดูกที่หลากหลายซึ่งดูเหมือนจะละเอียดมาก แต่โดยหลักแล้วพารามิเตอร์เหล่านั้นสะท้อนถึง BMD โดยรวม มากกว่าการวัดคุณลักษณะของกระดูกคอร์เทกซ์หรือทราเบคิวลาร์ที่แยกจากกัน แม้ว่าซอฟต์แวร์อาจให้ผลลัพธ์ที่สอดคล้องกับค่าจริงในประชากรที่การเปลี่ยนแปลงของคอร์เทกซ์และทราเบคิวลาร์เป็นสัดส่วนกับ aBMD แต่ซอฟต์แวร์ยังขาดความสามารถในการวัดเจาะจงรายบุคคลหรือตรวจวัดการเปลี่ยนแปลงเฉพาะที่ ข้อจำกัดนี้เห็นได้ชัดเป็นพิเศษในสถานการณ์ต่างๆ เช่น การรักษาด้วยยาเสริมสร้างกระดูก (anabolic therapy) ซึ่งพารามิเตอร์ของกระดูกคอร์เทกซ์และทราเบคิวลาร์อาจเปลี่ยนแปลงในทิศทางตรงกันข้ามกัน และ 3D-DXA ไม่สามารถสะท้อนถึงการเปลี่ยนแปลงที่แท้จริงที่สังเกตได้จาก QCT สิ่งนี้ทำให้เกิดความกังวลอย่างมากต่อการใช้งานในการดูแลทางคลินิกตามปกติ หรือการใช้เป็นเครื่องมือวิจัยที่เชื่อถือได้เดิมที 3D-DXA ได้รับการพัฒนาเพื่อช่วยวินิจฉัยโรคกระดูกพรุนได้ดีขึ้น โดยให้ค่าประมาณของ vBMD แบบบูรณาการ (integral vBMD) [70, 71] การที่ไม่ได้พยายามประเมินส่วนประกอบของคอร์เทกซ์และทราเบคิวลาร์แยกจากกัน ทำให้ค่า integral vBMD ที่สร้างโดย 3D-DXA อาจยังคงเป็นค่าประมาณที่ถูกต้อง ต่อมามีการขยายระเบียบวิธีเพื่อพยายามปรับปรุงการประเมินความเสี่ยงของการแตกหักโดยการวิเคราะห์พารามิเตอร์ของแบบจำลองโดยตรง เนื่องจากพารามิเตอร์เหล่านี้อธิบายลักษณะทางสัณฐานวิทยาของแบบจำลองทางสถิติได้อย่างสมบูรณ์ [51, 72, 73, 74] อย่างไรก็ตาม ข้อจำกัดที่สำคัญของ 3D-DXA ตามที่ระบุไว้ในบทวิจารณ์นี้ ยังคงอยู่และส่งผลต่อความแม่นยำและความน่าเชื่อถือ
การศึกษานี้มีข้อจำกัดเนื่องจากขาดความโปร่งใสจากบริษัทที่จำหน่าย 3D-DXA เชิงพาณิชย์ ได้แก่ 3D-Shaper Medical, DMS Imaging และ Fujifilm ด้วยเหตุนี้ จึงต้องอาศัยข้อมูลที่สาธารณะเข้าถึงได้และประสบการณ์ส่วนตัวของผมเองในการพัฒนาระเบียบวิธีนี้ ผมขอแนะนำให้ผู้อ่านขอคำชี้แจงจากบริษัทเหล่านี้หรือตัวแทน ในเรื่องเกี่ยวกับแง่มุมต่างๆ ของ 3D-DXA และ 3D-Shaper ที่ยังไม่ได้เปิดเผย
การประเมินจากสมาคมวิชาชีพอาจให้คำแนะนำที่มีคุณค่า โดยการให้การประเมินความถูกต้องของ 3D-DXA อย่างเป็นอิสระ และกำหนดข้อเสนอแนะอย่างเป็นทางการเกี่ยวกับการใช้งาน แม้ว่าการปรับปรุงแนวทางปฏิบัติสำหรับ dual-energy X-ray absorptiometry โดย International Working Group on DXA Best Practices จะระบุไว้เกี่ยวกับ 3D-DXA ว่า "ยังต้องการหลักฐานเพิ่มเติมเพื่อจัดทำข้อเสนอแนะสำหรับการใช้เทคนิคการถ่ายภาพรูปแบบใหม่เหล่านี้ในการปฏิบัติงานทางคลินิก" [75] ผมเชื่อว่าขณะนี้มีหลักฐานเพียงพอที่จะจัดทำข้อเสนอแนะได้แล้ว และผมหวังว่าบทวิจารณ์นี้จะเป็นประโยชน์ในประเด็นดังกล่าว
สรุปได้ว่า เมื่อพิจารณาถึงข้อจำกัดพื้นฐานของ 3D-DXA ผมขอประเมินอย่างมืออาชีพว่าพารามิเตอร์คอร์เทกซ์และทราเบคิวลาร์ที่ได้จาก 3D-DXA ไม่ควรนำไปใช้เพื่อวัตถุประสงค์ในการวิจัย และไม่เหมาะสมสำหรับการใช้งานทางคลินิก เช่น การวินิจฉัย การติดตามผล หรือการสนับสนุนการตัดสินใจเลือกวิธีรักษา
ส่วนร่วมของผู้เขียน
TW มีส่วนร่วมในการกำหนดแนวคิด, การคัดกรองข้อมูล, การวิเคราะห์อย่างเป็นทางการ, การสืบสวน, ระเบียบวิธี, ทรัพยากร, การนำเสนอภาพ และการเขียนต้นฉบับการระดมทุน
ไม่ได้รับการระดมทุนสำหรับการศึกษานี้การเข้าถึงข้อมูล
ข้อมูลทั้งหมดที่นำเสนอในบทความนี้สามารถขอได้จากผู้เขียนตามคำขอความขัดแย้งทางผลประโยชน์
ผู้เขียนเป็นผู้ร่วมประดิษฐ์สิทธิบัตรที่เกี่ยวข้องกับระเบียบวิธีที่รองรับซอฟต์แวร์ 3D-DXA ผู้เขียนได้มีส่วนร่วมในการหารือเกี่ยวกับทรัพย์สินทางปัญญาและที่มาของรหัสซอฟต์แวร์ 3D-DXA เชิงพาณิชย์, แบบจำลองทางสถิติ และสื่อประชาสัมพันธ์ ผู้เขียนไม่ได้มีความเกี่ยวข้องกับ 3D-Shaper Medical หรือบริษัทอื่นๆ ที่เกี่ยวข้องกับการแสวงหาประโยชน์เชิงพาณิชย์จาก 3D-DXA และไม่ได้รับส่วนของผู้ถือหุ้น, ค่าลิขสิทธิ์ หรือค่าตอบแทนทางการเงินอื่นใด ผู้เขียนเคยบรรยายให้กับ UCB ในเวทีการศึกษา และได้รับการสนับสนุนทุนวิจัยจาก Amgen Inc. และ Lilly ความคิดเห็นที่แสดงในบทความนี้เป็นของผู้เขียนเพียงผู้เดียว และอ้างอิงจากการประเมินระเบียบวิธีและหลักฐานทางวิทยาศาสตร์ที่มีอยู่อย่างถี่ถ้วนเอกสารอ้างอิง
- Whitmarsh T (2012). 3D Reconstruction of the Proximal Femur and Lumbar Vertebrae from Dual-Energy X-Ray Absorptiometry for Osteoporotic Risk Assessment
- Humbert L, Martelli Y, Fonolla R, et al. (2017). 3D-DXA: Assessing the Femoral Shape, the Trabecular Macrostructure and the Cortex in 3D from DXA images. IEEE Transactions on Medical Imaging, 36(1), 27–39.
- Whitmarsh T, Humbert L, De Craene M, et al. (2011). Reconstructing the 3D Shape and Bone Mineral Density Distribution of the Proximal Femur From Dual-Energy X-Ray Absorptiometry. IEEE Transactions on Medical Imaging, 30(12), 2101–2114.
- Ahmad O, Ramamurthi K, Wilson KE, et al. (2010). Volumetric DXA (VXA): A new method to extract 3D information from multiple in vivo DXA images. Journal of Bone and Mineral Research, 25(12), 2744–2751.
- Väänänen SP, Grassi L, Flivik G, et al. (). Generation of 3D shape, density, cortical thickness and finite element mesh of proximal femur from a DXA image. Medical Image Analysis, 24(1).
- Whitmarsh T, Humbert L, De Craene M, et al. 3D bone mineral density distribution and shape reconstruction of the proximal femur from a single simulated DXA image: an in vitro study. In: Dawant BM, Haynor DR, eds. Medical Imaging 2010: Image Processing. Vol. 7623. SPIE; 2010:76234U.
- Whitmarsh T. Concerns regarding the use of 3D-DXA. Bone. 2021;149:115939.
- Treece G, Gee A (2015). Independent measurement of femoral cortical thickness and cortical bone density using clinical CT. Medical Image Analysis, 20(1), 249–264.
- Freitas L, Amorim T, Humbert L, et al. (2018). Cortical and trabecular bone analysis of professional dancers using 3D-DXA: a case–control study. Journal of Sports Sciences, 37(1), 82–89.
- Gracia-Marco L, García-Fontana B, Ubago-Guisado E, et al. (2019). Analysis of Bone Impairment by 3D DXA Hip Measures in Patients With Primary Hyperparathyroidism: A Pilot Study. The Journal of Clinical Endocrinology \& Metabolism, 105(1), 175–184.
- Orduna G, Humbert L, Fonolla R, et al. (2018). Cortical and Trabecular Bone Analysis of Patients With High Bone Mass From the Barcelona Osteoporosis Cohort Using 3-Dimensional Dual-Energy X-ray Absorptiometry: A Case-Control Study. Journal of Clinical Densitometry, 21(4), 480–484.
- Gifre L, Humbert L, Muxi A, et al. (2017). Analysis of the evolution of cortical and trabecular bone compartments in the proximal femur after spinal cord injury by 3D-DXA. Osteoporosis International, 29(1), 201–209.
- García Hoyos M, Humbert L, Salmón Z, et al. (2019). Analysis of volumetric BMD in people with Down syndrome using DXA-based 3D modeling. Archives of Osteoporosis, 14(1).
- Beck B, Harding A, Weeks B, et al. (2021). Response to “Concerns regarding the use of 3D-DXA”. Bone, 149, 115936.
- Winzenrieth R, Humbert L, Di Gregorio S, Bonel E, García M, Del Rio L. Effects of osteoporosis drug treatments on cortical and trabecular bone in the femur using DXA-based 3D modeling. Osteoporos Int.2018;29(10):2323–2333.
- Cummings SR, Cauley JA, Palermo L, et al. Racial differences in hip axis lengths might explain racial differences in rates of hip fracture. Osteoporos Int.1994;4(4):226–229.
- Kim KM, Brown JK, Kim KJ, et al. Differences in femoral neck geometry associated with age and ethnicity. Osteoporos Int. 2010;22(7):2165–2174.
- Sone T, Humbert L, Lopez M, et al. (2022). Assessment of femoral shape, trabecular and cortical bone in Japanese subjects using DXA-based 3D modelling. JOURNAL OF BONE AND MINERAL RESEARCH, 37, 214--214.
- Varoquaux G, Cheplygina V (2022). Machine learning for medical imaging: methodological failures and recommendations for the future. npj Digital Medicine, 5(1).
- Hadjiiski L, Cha K, Chan H, et al. (). AAPM task group report 273: Recommendations on best practices for AI and machine learning for computer‐aided diagnosis in medical imaging. Medical Physics, 50(2).
- Huisman M (2024). When AUC-ROC and accuracy are not accurate: what everyone needs to know about evaluating artificial intelligence in radiology. European Radiology, 34(12), 7892–7894.
- Gallifant J, Bitterman DS, Celi LA, et al. (2024). Ethical debates amidst flawed healthcare artificial intelligence metrics. npj Digital Medicine, 7(1).
- Amani A, Bellver M, del Rio L, et al. (2022). Femur 3D-DXA Assessment in Female Football Players, Swimmers, and Sedentary Controls. International Journal of Sports Medicine, 44(06), 420–426.
- Maïmoun L, Renard E, Humbert L, et al. (2021). Modification of bone mineral density, bone geometry and volumetric BMD in young women with obesity. Bone, 150, 116005.
- Jain RK, López Picazo M, Humbert L, et al. (2025). Bone Structural Parameters as Measured by 3-Dimensional Dual-Energy X-Ray Absorptiometry Are Superior in Black Women and Demonstrate Unique Associations With Prior Fracture Versus White Women. Endocrine Practice, 31(2), 152–158.
- Gracia-Marco L, Gonzalez-Salvatierra S, Garcia-Martin A, et al. (2021). 3D DXA Hip Differences in Patients with Acromegaly or Adult Growth Hormone Deficiency. Journal of Clinical Medicine, 10(4), 657.
- Toussirot E, Winzenrieth R, Aubin F, et al. (2024). Areal bone mineral density, trabecular bone score and 3D-DXA analysis of proximal femur in psoriatic disease. Frontiers in Medicine, 11.
- Ubago-Guisado E, Moratalla-Aranda E, González-Salvatierra S, et al. (2023). Do patients with type 2 diabetes have impaired hip bone microstructure? A study using 3D modeling of hip dual-energy X-ray absorptiometry. Frontiers in Endocrinology, 13.
- Guerra FS, Palladino N, Winzenrieth R, et al. (2024). Advanced 3D-DXA insights into bone density changes in hyperparathyroidism. Journal of Diabetes \& Metabolic Disorders, 23(2), 2191–2199.
- Kužma M, Vaňuga P, Ságová I, et al. Non-invasive DXA derived bone structure assessment of acromegaly patients: a cross sectional study. Eur J Endocrinol. 2019;180(3):201–211.
- Maïmoun L, Aouinti S, Puech M, et al. Modification of bone architecture following sleeve gastrectomy: a five-year follow-up. J Bone Miner Res. 2024;40(2):251–261.
- Maïmoun L, Gelis A, Serrand C, et al. (2023). Alteration of Volumetric Bone Mineral Density Parameters in Men with Spinal Cord Injury. Calcified Tissue International, 113(3), 304–316.
- Harding AT, Weeks BK, Lambert C, et al. (2020). Effects of supervised high-intensity resistance and impact training or machine-based isometric training on regional bone geometry and strength in middle-aged and older men with low bone mass: The LIFTMOR-M semi-randomised controlled trial. Bone, 136, 115362.
- Gil-Cosano JJ, Ubago-Guisado E, Sánchez MJ, et al. (2020). The effect of an online exercise programme on bone health in paediatric cancer survivors (iBoneFIT): study protocol of a multi-centre randomized controlled trial. BMC Public Health, 20(1).
- Humbert L, Whitmarsh T, De Craene M, et al. (2010). 3D reconstruction of both shape and Bone Mineral Density distribution of the femur from DXA images. 2010 IEEE International Symposium on Biomedical Imaging: From Nano to Macro, 456–459.
- O’Rourke D, Beck BR, Harding AT, et al. (2021). Assessment of femoral neck strength and bone mineral density changes following exercise using 3D-DXA images. Journal of Biomechanics, 119, 110315.
- Dudle A, Gugler Y, Pretterklieber M, et al. (2023). 2D-3D reconstruction of the proximal femur from DXA scans: Evaluation of the 3D-Shaper software. Frontiers in Bioengineering and Biotechnology, 11.
- Clotet J, Martelli Y, Di Gregorio S, et al. (2018). Structural Parameters of the Proximal Femur by 3-Dimensional Dual-Energy X-ray Absorptiometry Software: Comparison With Quantitative Computed Tomography. Journal of Clinical Densitometry, 21(4), 550–562.
- Ramamurthi K, Ahmad O, Engelke K, et al. (2011). An in vivo comparison of hip structure analysis (HSA) with measurements obtained by QCT. Osteoporosis International, 23(2), 543–551.
- Whitmarsh T, Treece GM, Gee AH, et al. (2015). Mapping Bone Changes at the Proximal Femoral Cortex of Postmenopausal Women in Response to Alendronate and Teriparatide Alone, Combined or Sequentially. Journal of Bone and Mineral Research, 30(7), 1309–1318.
- Whitmarsh T, Treece GM, Gee AH, et al. (2016). The Effects on the Femoral Cortex of a 24 Month Treatment Compared to an 18 Month Treatment with Teriparatide: A Multi-Trial Retrospective Analysis. PLOS ONE, 11(2), e0147722.
- Huininga K, Koromani F, Zillikens M, et al. (2024). Use of 3D Shaper Analysis for the Assessment of Fracture Risk in a Population-Based Setting. JBMR Plus, 8(Supplement\_1), i1--i340.
- Huininga K, Koromani F, Zillikens MC, et al. (2024). Use of 3D Shaper Analysis for the Assessment of Fracture Risk in a Population-based Setting. ASBMR 2024 Annual Meeting Abstracts and Abstract Book.
- Qasim M, López Picazo M, Ruiz Wills C, et al. (2024). 3D-DXA Based Finite Element Modelling for Femur Strength Prediction: Evaluation Against QCT. Journal of Clinical Densitometry, 27(2), 101471.
- Iki M, Winzenrieth R, Tamaki J, et al. (2021). Predictive ability of novel volumetric and geometric indices derived from dual-energy X-ray absorptiometric images of the proximal femur for hip fracture compared with conventional areal bone mineral density: the Japanese Population-based Osteoporosis (JPOS) Cohort Study. Osteoporosis International, 32(11), 2289–2299.
- Grassi L, Väänänen SP, Ristinmaa M, et al. Prediction of femoral strength using 3D finite element models reconstructed from DXA images: validation against experiments. Biomechanics and Modeling in Mechanobiology, 16(3).
- Grassi L, Fleps I, Sahlstedt H, et al. (). Validation of 3D finite element models from simulated DXA images for biofidelic simulations of sideways fall impact to the hip. Bone, 142.
- Grassi L, Väänänen SP, Jehpsson L, et al. (). 3D Finite Element Models Reconstructed From 2D Dual‐Energy X‐Ray Absorptiometry (DXA) Images Improve Hip Fracture Prediction Compared to Areal BMD in Osteoporotic Fractures in Men (MrOS) Sweden Cohort. Journal of Bone and Mineral Research, 38(9).
- Grassi L, Väänänen SP, Voss A, et al. DXA-based 3D finite element models predict hip fractures better than areal BMD in elderly women. Bone. 2025;195:117457.
- Allison SJ, Poole KES, Treece GM, et al. (2015). The Influence of High-Impact Exercise on Cortical and Trabecular Bone Mineral Content and 3D Distribution Across the Proximal Femur in Older Men: A Randomized Controlled Unilateral Intervention. Journal of Bone and Mineral Research, 30(9), 1709–1716.
- Whitmarsh T, Fritscher KD, Humbert L, et al. (2011). Hip fracture discrimination using 3D reconstructions from Dual-energy X-ray Absorptiometry. 2011 IEEE International Symposium on Biomedical Imaging: From Nano to Macro, 1189–1192.
- Winzenrieth R, Ominsky M, Wang Y, et al. (2021). Differential effects of abaloparatide and teriparatide on hip cortical volumetric BMD by DXA-based 3D modeling. Osteoporosis International, 32(3), 575–583.
- England JR, Cheng PM (2019). Artificial Intelligence for Medical Image Analysis: A Guide for Authors and Reviewers. American Journal of Roentgenology, 212(3), 513–519.
- Lewiecki EM, Betah D, Humbert L, et al. (2024). 3D-modeling from hip DXA shows improved bone structure with romosozumab followed by denosumab or alendronate. Journal of Bone and Mineral Research, 39(4), 473–483.
- Winzenrieth R, Kostenuik P, Boxberger J, et al. (2022). Proximal Femur Responses to Sequential Therapy With Abaloparatide Followed by Alendronate in Postmenopausal Women With Osteoporosis by 3D Modeling of Hip Dual‐Energy X‐Ray Absorptiometry (DXA). JBMR Plus, 6(4).
- Winzenrieth R, Humbert L, Boxberger JI, et al. (2022). Abaloparatide Effects on Cortical Volumetric BMD and Estimated Strength Indices of Hip Subregions by 3D-DXA in Women With Postmenopausal Osteoporosis. Journal of Clinical Densitometry, 25(3), 392–400.
- Bennett C, Miller M, Wolford G (2009). Neural correlates of interspecies perspective taking in the post-mortem Atlantic Salmon: an argument for multiple comparisons correction. NeuroImage, 47, S125.
- Poole KE, Treece GM, Gee AH, et al. (2014). Denosumab Rapidly Increases Cortical Bone in Key Locations of the Femur: A 3D Bone Mapping Study in Women With Osteoporosis. Journal of Bone and Mineral Research, 30(1), 46–54.
- Sato M, Westmore M, Ma YL, et al. (2004). Teriparatide [PTH(1–34)] Strengthens the Proximal Femur of Ovariectomized Nonhuman Primates Despite Increasing Porosity. Journal of Bone and Mineral Research, 19(4), 623–629.
- Hadji P, Kamali L, Thomasius F, et al. (2024). Real-world efficacy of a teriparatide biosimilar (RGB-10) compared with reference teriparatide on bone mineral density, trabecular bone score, and bone parameters assessed using quantitative ultrasound, 3D-SHAPER® and high-resolution peripheral computer tomography in postmenopausal women with osteoporosis and very high fracture risk. Osteoporosis International, 35(12), 2107–2116.
- Sone T, Ohnaru K, Sugai T, et al. (2023). The effects of abaloparatide on hip geometry and biomechanical properties in Japanese osteoporotic patients assessed using DXA-based hip structural analysis: results of the Japanese phase 3 ACTIVE-J trial. Archives of Osteoporosis, 18(1).
- Genant HK, Engelke K, Bolognese MA, et al. (2016). Effects of Romosozumab Compared With Teriparatide on Bone Density and Mass at the Spine and Hip in Postmenopausal Women With Low Bone Mass. Journal of Bone and Mineral Research, 32(1), 181–187.
- MEDICAL 3S (2021). Webinar - Use of 3D-Shaper in clinical research: state of the art and potential applications
- Casado Burgos E, Di Gregorio S, González Macías J, et al. (2019). Datos de referencia de mediciones óseas en modelos 3D de fémur proximal en población española cn DXA: Proyecto SEIOMM 3D-SHAPPER. Congreso SEIOMM (24º : 2019 : Gerona).
- Brance ML, Saravi FD, Henr{\'i}quez MM, et al. (2020). Reference Values of Three-Dimensional Proximal Femur Parameters from Bone Densitometry Images in Healthy Subjects from Argentina. World Congress on Osteoporosis, Osteoarthritis and Musculoskeletal Diseases, 372--372.
- Jennings I (). 3D Shaper Technology: Revolutionizing Bone Health Analysis
- Al-Hashimi L, Klotsche J, Ohrndorf S, et al. (2023). Trabecular Bone Score Significantly Influences Treatment Decisions in Secondary Osteoporosis. Journal of Clinical Medicine, 12(12), 4147.
- Food {, Administration} D (2022). 510(k) Summary: K220822
- Broy SB, Cauley JA, Lewiecki ME, et al. (2015). Fracture Risk Prediction by Non-BMD DXA Measures: the 2015 ISCD Official Positions Part 1: Hip Geometry. Journal of Clinical Densitometry, 18(3), 287–308.
- Whitmarsh T, Humbert L, Craene MD, et al. (2009). Reconstrucción de la forma del fémur y densidad mineral ósea en 3D para el diagnóstico de osteoporosis a partir de DXA
- Whitmarsh T, Humbert L, Del Río Barquero LM, et al. (2011). Volumetric Bone Mineral Density Estimation using a 3D Reconstruction Method from Dual-energy X-ray Absorptiometry. ASBMR 2011 Annual Meeting Abstracts and Abstract Book.
- Whitmarsh T, Fritscher KD, Humbert L, et al. (2011). A Statistical Model of Shape and Bone Mineral Density Distribution of the Proximal Femur for Fracture Risk Assessment. Medical Image Computing and Computer-Assisted Intervention – MICCAI 2011, 393–400.
- Whitmarsh T, Fritscher KD, Humbert L, et al. (2012). Hip fracture discrimination from dual-energy X-ray absorptiometry by statistical model registration. Bone, 51(5), 896–901.
- Martelli Y, Whitmarsh T, Humbert L, et al. (2012). A software framework for 3D reconstruction and fracture risk assessment of the proximal femur from dual-energy x-ray absorptiometry. Proceedings of VPH 2012: Virtual Physiological Human - Integrative approaches to computational biomedicine.
- Slart RHJA, Punda M, Ali DS, et al. (2024). Updated practice guideline for dual-energy X-ray absorptiometry (DXA). European Journal of Nuclear Medicine and Molecular Imaging, 52(2), 539–563.