Abstract
3D-DXA, as implemented in the software tool 3D-Shaper, is a software method that generates a 3D reconstruction of the proximal femur from a single 2D DXA image by registering a statistical model. Implementations of 3D-DXA aim to provide estimates of trabecular, cortical, and structural parameters similar to those derived from quantitative computed tomography (QCT). As the inventor and developer of the software methods upon which 3D-DXA is built, I have been observing its adoption and widespread use with increasing concern. This article provides a critical evaluation of the methodological limitations inherent to 3D-DXA and discusses their implications for research and patient care. The primary issue is that the limited visibility of the cortex in a DXA image prevents 3D-DXA from accurately deriving cortical parameters. Instead, the software relies on predictions based on overall BMD rather than direct cortical measurements. This may lead to results that do not reflect actual cortical measurements. Additional concerns include the population bias due to the statistical model being derived from a specific demographic, and limited reconstruction accuracy by using single-view DXA images. These limitations have likely resulted in incorrect measurements and research outcomes, which have largely gone unrecognized due to the use of inappropriate performance assessment metrics and the absence of multiple comparison corrections in studies involving 3D-DXA. Despite these limitations, 3D-DXA has received regulatory approval in various countries, potentially compromising the accuracy of clinical diagnoses and treatment decisions. By highlighting these issues, this article aims to inform clinicians, researchers, and regulatory bodies about the significant limitations of 3D-DXA. It underscores the urgent need for a reevaluation of its use in research and clinical settings to prevent misinterpretation of results and to ensure patient safety.Keywords
3D-DXA, 3D-Shaper, Quantitative Computed Tomography, Bone Mineral Density, Dual-energy X-ray Absorptiometry, Cortical Parameter Mapping, Hip Structure Analysis.Lay Summary
This review critically examines the 3D-DXA software, also known as 3D-Shaper, which aims to estimate trabecular, cortical, and structural parameters of the proximal femur from a single DXA image. 3D-DXA has several inherent limitations that may lead to inaccurate measurements, potentially affecting research outcomes and patient treatment decisions. Understanding these issues is crucial for researchers and clinicians in order to avoid misinterpretations that could impact our knowledge of bone physiology, drug treatment effects, and patient safety.Introduction
3D-DXA is a software method that registers a 3D statistical deformable model onto a single 2D DXA image to generate a 3D model of the proximal femur [1]. The model is constructed from a set of quantitative computed tomography (QCT) scans of a Spanish Caucasian population of 81 women and 30 men with a mean age of 56.2 ± 12.1 yr, ranging between 30 and 84 yr [2]. The parameters of the statistical model subsequently describe the main variation in shape and density distribution of this population. In an iterative process, the parameters of the model, as well as the location, orientation and size, are searched in an attempt to have the projection of the model resemble the DXA image (Figure 1). From the resulting 3D model, cortical parameters are then measured across the bone surface, along with trabecular volumetric BMD values within. A mean absolute error of 0.33 mm for cortical thickness and 72 mg/cm³ for cortical density was reported when comparing 3D-DXA to QCT, with correlation coefficients greater or equal to 0.86 [2].
Although other methods have been proposed for the 3D reconstruction of bone structures from DXA images using a statistical model [4, 5], it is the software method first published in 2010 [6] that was later commercialised as 3D-DXA by Galgo Medical SL (Barcelona, Spain), a spin-off company of the Pompeu Fabra University (Barcelona, Spain). This software was later extended to measure the cortical thickness and cortical bone mineral density (BMD) from the volumetric reconstructions [2], which is now commercialised as 3D-Shaper by 3D-Shaper Medical SL (Barcelona, Spain), a further spin-off company of Galgo Medical SL, providing both a service and a software. The software is licensed to DMS Imaging (Mauguio, France) to be sold as 3D-DXA with their Stratos/Medix DXA devices. Fujifilm (Tokyo, Japan) is selling the same DXA devices by DMS under the Fujifilm brand name FDX Visionary DXA. Also Imex Medical (São José, Brazil) sells these devices as the Elipse series and Radiología SA (Madrid, Spain) sells them as Radioscore - DR. These all include the option of adding 3D-DXA.
Having developed the original software method [1], I possess a deep understanding of its inherent limitations that may not be apparent to other users and researchers. Although I have explained the main limitation with this software in a letter to the editor of Bone [7], 3D-DXA continues to be sold and used throughout the world. 3D-Shaper has received approval from regulatory authorities in the EU, Japan, Thailand, Argentina, and a 510(k) clearance from the FDA, authorizing its use for diagnosing and making treatment decisions in patients. Given these endorsements, it is critical and urgent to address and clarify some of the misconceptions about this software, thereby enhancing understanding of its limitations.
Methodological limitations
In this section I will explain some of the limitations of the methodology that 3D-DXA is based on, as well as specific implementation details that may contribute to further inaccuracies.Cortical parameters are not measured
The main issue lies with a lack of visibility of the cortex in DXA images for 3D-DXA to derive its cortical parameters from. To illustrate this, I would like to revisit a figure from the letter to the editor of Bone (Figure 2). The DXA image clearly shows that at most locations on the bone surface, there is no discernible cortex to derive the cortical parameters from. This applies to the contour of the bone projection (A) and is especially true where two opposing cortices are perpendicular to the X-ray detector (B). This is evident in this image from the GE iDXA scanner with a pixel size of 0.3 x 0.25mm, but becomes even more pronounced in images using older GE Prodigy DXA devices, which produce considerably lower resolution images with a pixel size of 0.6 x 1.05mm, but are also supported by the 3D-Shaper software.
Instead of measuring the cortical parameters directly from the DXA image, 3D-DXA registers a statistical model of the shape and density distribution onto the DXA image [3], and extracts the cortical parameters from this model [2]. This model is constructed from a set of calibrated QCT scans, in which the Hounsfield units of the voxels in a standard CT scan are converted to BMD values using a calibration phantom.
To construct the model, the proximal femur in each QCT scan is first segmented, meaning a surface mesh of the proximal femur is constructed. A mathematical technique, such as Principal Component Analysis, is then applied to the points of the aligned femur bone surfaces, resulting in an average shape and a set of Principal Components (PCs) that describe the variations in shape, ordered by their importance.
To construct the statistical model of the density distribution, the QCT volumes are deformed to the mean shape, and the same statistical method is applied to the BMD values in the volumes, generating a mean volume and a set of PCs that describe the variation in bone mineral density across the volume.
Each principal component represents the way in which the bone’s shape or density can vary (Figure 3). The model parameters are numerical factors that determine how much of each component is added to the mean model. Adjusting these parameters modifies the shape or density distribution, producing new model instances. The parameters are constrained to typically 2.5 to 3 standard deviations of its variation to make sure that the bone model always looks realistic according to the set of QCT scans it is built from. To create a new instance of the model, the density volume is deformed to match the new shape, using a Thin Plate Splines (TPS) transformation calculated with a subset of the shape points.
3D-DXA subsequently generates a 3D reconstruction by iterative changing the model parameters and generating corresponding model instances, as well as rotating and translating the model, until the projection of the model matches with the DXA image according to a predetermined similarity metric threshold (Figure 1).
The cortical thickness and cortical density is then measured from the instance of the model using a method equivalent to a deconvolution approach proposed for QCT [8]. Therefore, the cortical parameters are not measured from the DXA image, but from a parametric model that was registered onto this image.
Thus, when maps of the cortical parameters are presented by 3D-DXA, with values at locations where no cortex could possibly have been measured [9, 10, 11, 12, 13], these maps were merely derived from the model instance. Although 3D-Shaper Medical clarifies in a response to a letter to the editor of Bone [14] that these parameters are estimated rather than measured, a more accurate description would be that 3D-DXA predicts these values using a complex and potentially error-prone statistical method. Given the limited visibility of the cortex in DXA images, the software primarily relies on overall bone density and is constrained by the statistical characteristics of the Spanish population on which the model is based. The broader implications of this limitation are explored further in the review.
Number of model parameters used
There is no single parameter that increases the cortical thickness. Instead, the representation of the cortex depends on a linear combination of the average 3D volume and the PCs of the density model. In Figure 4 we can see an example of how the mean and first three PCs can generate a new model instance. In this example, the model parameters, which are the scaling factors for the PCs, have values of 2, 3, and -1.5, respectively. While PC1 increases or decreases the density everywhere, the other PCs change the density distribution in non descriptive ways. This figure also illustrates how the cortical parameters are subsequently estimated from this new volume by fitting a smoothed stair-step model. Selective and independent adjustments to cortical thickness, cortical density, or trabecular density, if achievable at all, would require a complex combination of multiple principal components and, consequently, many model parameters.Typically a subset of principal components is retained that describe the main modes of variation. This reduces the variation of the BMD distribution and surface points to a reduced set of parameters. How many model parameters are needed is typically determined by calculating number of shape and density model parameters that describe 95% of the variations within its population, or by determining the "elbow" in the cumulative variance plot. However, more accurate is to use Horn's parallel analysis [6] which mathematically assesses which PCs should be considered noise and can therefore be discarded.
Although the number of parameters that is used is a critical element in any statistical modeling approach, to my knowledge this number, or the method to derive this number, has never been disclosed by 3D-Shaper Medical. If the number of parameters is not appropriately large, as determined by Horn's parallel analysis, it may not be able to accurately represent the full range of variation in the femur morphology of the input population. Furthermore, if this number of parameters is not the same in research and clinical applications, there will be a disconnect in the reported and clinical accuracy of 3D-DXA.
Potential population bias
Any 3D bone model generated by 3D-DXA is derived from statistics on the variations of the input population. In the case of 3D-Shaper, the statistical model is built from a Spanish population of 81 women and 30 men with a mean age of 56.2 ± 12.1 years [30 years – 84 years] [2] without treatments or diseases that impact bone metabolism [15]. It is clear that femur morphology differs between men and women, but demographics also play an important role. For example, the femur bones of Caucasian populations are significantly different from those of Asian populations, as documented in previous studies [16].A model built from a Caucasian population will not be able to generate a reconstruction that fits every subject in an Asian population. This is because the parameters of a statistical model are constrained to 3 standard deviation around the average femur model of a Spanish population. For instance, one study reports that White women have a femoral neck cortical thickness of 1.84±0.03 mm, while for Korean women it is 2.41±0.71 mm, as measured by QCT scans [17]. Consequently, a Korean woman with an average cortical thickness of 2.41 mm would fall outside the range of variation for a White population when constrained to three standard deviations (1.75–1.93 mm). This example illustrates the importance of having the model represent the target population.
Although the measures by 3D-DXA correlate with QCT in a Japanese population [18], this is simply because all parameters correlate with the areal BMD. It does not mean that patient specific reconstructions were obtained. In particular, the estimated cortical parameters may deviate substantially from the true values, especially regarding their spatial distribution. Even if the predicted femur shape is faulty, the density values, including cortical thickness and cortical BMD will still mirror the aBMD, as long as the projection of the statistical model largely overlaps with the bone in the DXA image. A person with low aBMD will have a low vBMD, a low cortical BMD and thinner cortex compared to a patient with high aBMD in any population. Furthermore, [18] reported only correlations, and there may be significant bias when applying a model developed from a Spanish population to a Japanese population, which could have clinical consequences. Despite this fundamental limitation, 3D-DXA is currently being marketed in Asia, including countries such as Japan, Thailand, and India.
A statistical model needs to be trained on the population to which it is applied. This could mean building separate models for each gender, ethnicity, and potentially treatment type, or by including all these subgroups in one model, provided that enough parameters are retained to capture the full range of variability. This principle is well established for machine learning and artificial intelligence tools [19, 20, 21, 22] but is even more critical for statistical modeling approaches, where models are actively constrained by the input population. Nonetheless, 3D-DXA has been used in studies with populations that obviously differ from the model population, including: professional dancers[9], football players and swimmers[23] young women with obesity[24], black women[25], patients with high bone mass [11], with adult growth hormone deficiency [26] with psoriatic disease [27], with type 2 diabetes [28], with primary hyperparathyroidism [10, 29], with acromegaly [30], with down syndrome [13], after sleeve gastrectomy [31], men with spinal cord injury [32], Australian middle-aged and older men with low bone mass [33], and perhaps most concerning of all, paediatric cancer survivors [34].
Limited reconstruction accuracy
3D-DXA is a highly complex method prone to errors at multiple stages. These include inaccuracies from QCT calibration, deformable registration for building statistical models, deformation of the density model to the shape instance, discrepancies in BMD and resolution between QCT and DXA, and simplification of the model projection by an isometric projection instead of the fan beam projection. Each of these factors can introduce biases in unpredictable ways, potentially skewing the results. In addition, specific implementation details, such as building the statistical model from a very small set of 111 adult Spanish subjects (which limits the variance in shape, density, and cortical thickness), further restrict the applicability of this software tool.Furthermore, it is not clear whether 3D-Shaper can accurately read the proprietary data files from GE and Hologic devices, particularly with respect to correctly applying the calibration and correction factors for varying body compositions. These potential inaccuracies may influence 3D-Shaper results when applied to different populations or as population characteristics drift over time.
It stands to reason that, if the proximal femur shape and orientation is not perfectly matched with the DXA image, within a sub-millimetre accuracy, it should not be possible to extract the cortical thickness within a sub-millimetre accuracy, nor the cortical density. Unfortunately it is not possible to generate a perfect reconstruction from just a single 2D DXA image as an early study with 3D-DXA already showed [35]. Here it was shown that adding a second view reduces the shape error from 1.3mm to 0.9mm, and the BMD error from 4.4% to 3.2%, indicating a clear sub-optimal reconstruction from a single view. In contrast, computed tomography reconstructs a volume using hundreds of projections acquired from all angles around the femur. Thereby QCT does allow for the independent measurement of cortical and trabecular parameters.
3D-DXA can produce femur models with a completely different morphology depending on where the model parameter search converged, in particular if the correct rotation was not recovered. This can vary greatly, as evidenced by a study using 3D-DXA involving same-day repeated DXA scans, which revealed differences in predicted strength of up to 62% [36]. This study also reported element-by-element BMD differences reaching 30 ± 50%, which will likely reflect in a low repeatability accuracy for the cortical parameters as well, although these numbers were not provided. In a separate study, the correlation between 3D-Shaper and QCT density values was also reported to be low (r2 = 0.48) [37], further indicating a limited subject-specific reconstruction accuracy.
In a study on measuring the structural parameters of the femur using 3D-DXA, a correlation coefficient of r = 0.86 was reported for the femoral neck axis length [38] when correlating the measurements derived from the 3D-DXA volume with the ground truth measurements from CT. This is worse than when measured directly in the DXA image (r = 0.90, [39]). Also, the femoral neck shaft angles produced by 3D-DXA are of limited accuracy (r = 0.71, [38]). An obvious reason for the lack of this accuracy is because the femoral head is excluded from the reconstruction process using a mask to prevent the overlap of the hemipelvis from interfering with the reconstruction, although this could be resolved by adding a second model of the hemipelvis such as in [5].
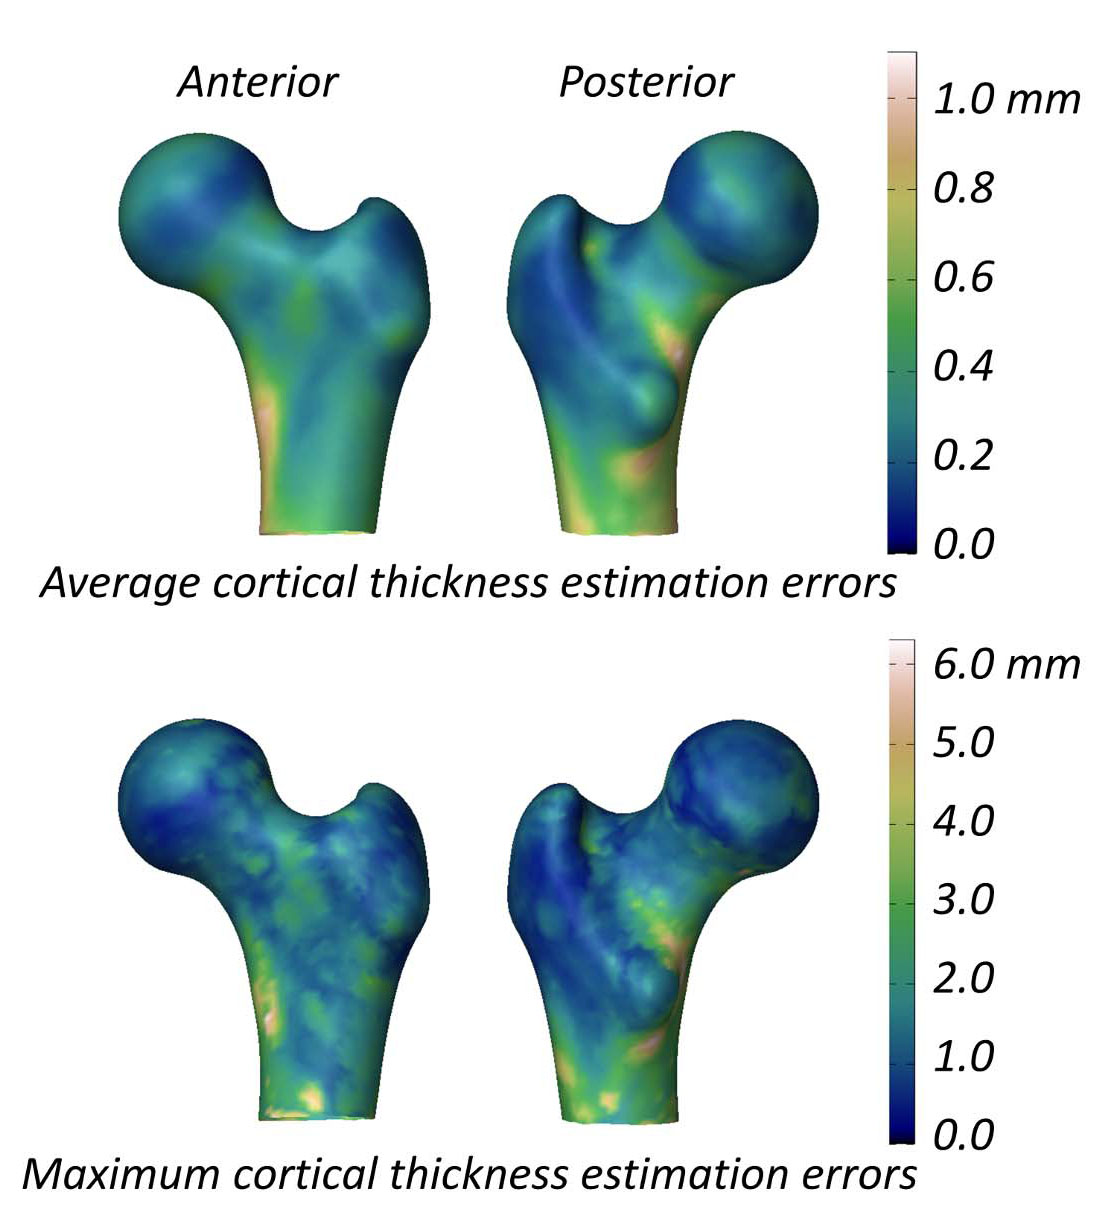
The study evaluating the ability of 3D-DXA to measure the cortical parameters reports a mean (± standard deviation) cortical thickness difference between 3D-DXA and QCT of 0.04 ± 0.21mm at the femoral neck and -0.07 ± 0.15 mm at the trochanter [2]. This study also presented a figure showing the mean and maximum absolute cortical thickness estimation errors across the femur model surface (Figure 5), with a mean error greater than 0.2 mm and maximum error greater than 1 mm across much of the femur surface. In comparison, a QCT study measuring cortical thickness changes following an 18‐month alendronate treatment reported a 1.4% increase, corresponding to an approximate 0.018 mm increase in cortical thickness [40]. Data compiled from three clinical trials on teriparatide indicated that cortical thickness increased by 0.035 mm [41]. Considering the 3D-DXA error exceeds these typical treatment-induced changes, 3D-DXA measurements are unlikely to distinguish reliably between true therapy-driven effects and methodological noise. In other words, if an individual’s cortical bone appears to change, it remains unclear whether this arises from genuine physiological change, or from the inherent 3D-DXA measurement error.
Limited benefit over areal BMD
In the statistical density model that 3D-DXA uses, the first model parameter accounts for the vast majority of the variation, and increasing its value leads to an increase in both the overall density and all cortical parameters [7]. Given that there is little information about the cortex in the DXA image, 3D-DXA primarily relies on the overall density, and thus, on the first model parameter. As a consequence, the cortical and trabecular parameters are inherently correlated. Although there may be some contribution from the inferior medial and lateral cortices of the shaft that are visible in the DXA image, the parameters returned by 3D-DXA predominantly reflect the total areal BMD (aBMD). This means that, if aBMD increases, the 3D-DXA analysis will show simultaneous increases in trabecular BMD, cortical BMD and cortical thickness. Indeed, a recent study presented at the 2024 European Calcified Tissue Society congress [42] and the 2024 annual meeting of the American Society for Bone and Mineral Research [43] confirms that 3D-shaper parameters are highly correlated to aBMD and therefore do not provide additional fracture prediction information.Furthermore, while the 3D-DXA reconstruction does capture the overall femoral silhouette visible in the DXA image, its ability to recover the neck axis length and neck shaft angle is limited. As a consequence, the reconstructed shape mainly reflects the general bone size, which is already provided by aBMD and does not add much to fracture strength prediction. Illustrative of this is the finding that strength predictions from 3D-DXA correlated with QCT (r2 = 0.88), but were not statistically better than when predicted only by femoral neck aBMD from the DXA image (r2 = 0.87) [37]. A study by 3D-Shaper Medical shows a similar correlation (r2=0.86) but a comparison with aBMD was excluded [44]. In a different study on a Japanese population, measures from 3D-Shaper were not statistically better in predicting hip fracture than the total hip aBMD [45].
There have been other articles published on a similar method of registering a 3D statistical model onto a 2D DXA image and predicting femoral strength [46, 47], with one study showing an improvement over aBMD in fracture risk prediction [48, 49]. This method may offer some advantages over 3D-DXA, such as the use of an additional pelvic model to help recover the full proximal femur shape. Although it remains subject to many of the same methodological limitations.
If 3D-DXA fails to outperform aBMD alone, it certainly cannot surpass a combination of aBMD and HSA parameters, which are directly measured from DXA images. This highlights the fundamental limitations of 3D-DXA and calls into question its justification for use in clinical or research settings. Nonetheless, 3D-Shaper Medical now offers a 3D-DXA based finite element analysis as a service.
Methods of validation
Despite the inherent limitations of 3D-DXA, numerous publications report positive findings on its accuracy. This discrepancy can be attributed to the use of inappropriate validation methods [21, 22] that tend to obscure the true limitations of the software. In the following sections, I will discuss the issues with these validations and how they create a perception of 3D-DXA’s reliability and clinical utility.Wrong performance assessment metrics
3D-Shaper Medical compared the surface mesh generated by 3D-DXA from a DXA image with the surface mesh manually generated from the same subjects QCT scan, resulting in a mean point-to-surface distance of 0.93 mm [2]. They also compared the cortical parameters, finding a mean absolute error of 0.33 mm for cortical thickness and 72 mg/cm³ for cortical density. However, there is no frame of reference to determine whether these reported errors are acceptable, which means these metrics do not necessarily validate the effectiveness of the software.Another way in which 3D-DXA was evaluated was through the use of correlations. Correlation coefficients of 0.86, 0.93, 0.95 and 0.91 were reported for trabecular, cortical, and integral vBMD, and cortical thickness respectively. However, these strong correlations are primarily due to the fact that all cortical parameters in both 3D-DXA models and QCT scans correlate strongly with overall density. Patients with higher-than-average aBMD in their DXA scans will, on average, also exhibit increased trabecular, cortical, and integral vBMD, along with a thicker cortex. These correlation results do not provide conclusive evidence of the software’s accuracy in generating patient-specific reconstructions and, in fact, may create a misleading impression of its performance.
Correlations are also used to evaluate population-based studies using 3D-DXA. Similar effects can be seen when 3D-DXA analyses show significant correlations between its parameters and the tested factors or across different populations. This is again because these parameters are inherently correlated with overall BMD and thus directly reflect changes or differences in aBMD. The findings may appear sensible and can closely mirror true changes. For instance, exercise increases both overall density and cortical bone mineral content [49], leading to seemingly sensible results from a 3D-DXA analysis when aBMD increases due to exercise. However, these do not reflect the actual cortical parameters themselves, but merely the underlying changes or differences in aBMD. Consequently, these studies can create a misleading impression of the effectiveness of 3D-DXA, giving a false sense of its capability to measure cortical parameters accurately.
A more appropriate evaluation would involve comparing the cortical parameters against a basic baseline model, such as a blind estimator. Here a blind estimator refers to a simple, naive method of estimation that does not account for individual variability and instead applies an average value from the entire population to all subjects. For example, a blind estimator for cortical thickness would use the mean cortical thickness map from a group of individuals and apply it uniformly to every case, regardless of their specific characteristics. This approach serves as a baseline, or minimum standard, against which more advanced methods should be evaluated. Any sophisticated method should, at the very least, outperform this basic estimation. To the best of my knowledge, such an evaluation has not yet been published.
Most publications on the 3D-DXA software showcase only successful reconstructions, which can create a false sense of confidence in the software’s reliability. To quantitatively assess the reliability of 3D-DXA, an evaluation of the failure rate can be performed. In a previous study [51], although not explicitly stated, only 80 out of 173 subjects were retained after excluding reconstructions identified as inaccurate through comparison of the model projections with the DXA images, yielding a failure rate exceeding 50%. To enable such an assessment, 3D-Shaper would need to provide a side-by-side display of the model projection and the DXA image. A more robust evaluation, however, would compare renderings and cross-sectional views of the resulting volumes with the ground-truth QCT scans and assess the failure rate in an independent evaluation.
In some instances, merely observing significant changes or differences is presented as evidence that 3D-DXA works, while disregarding whether the actual effects are correct. In response to my letter to the editor, significant differences between treatment groups were presented as evidence of 3D-DXA’s efficacy. However, in this assessment, the authors provide 2 different results for cortical BMD changes after TPTD treatment, one showing a significant increase [52] and the other a nonsignificant decrease [15]. Neither of these reflects the actual change that one would expect in TPTD treatment, as I explain in Section “Misleading results in drug efficacy studies”.
Absence of multiple comparison correction
The concern in this section is not primarily related to the 3D-DXA software itself, but rather to the service provided by 3D-Shaper Medical and the subsequent publications. The critical issue lies in the lack of multiple comparison corrections when reporting changes or differences in the 3D-DXA parameters, particularly in the cortical parameter maps.Applying multiple comparison corrections is crucial when analyzing data with multiple distinct measurements. For 3D-Shaper, the software generates 71 bone parameters, with each representing a separate statistical test. Without adjusting for these multiple comparisons, such as with a Bonferroni correction, the likelihood of obtaining significant results by chance increases, leading to false conclusions. Despite this, studies using 3D-Shaper often report significant changes or differences without applying any form of multiple comparison correction [10, 24, 27, 28], creating an unwarranted sense of confidence in the results. This can be misleading when certain parameters are measured but not reported, a form of p-hacking bias [53], where significant results are highlighted while ignoring the increased risk of false positives due to the large number of tests conducted.
A similar issue occurs when studies using 3D-Shaper present color-coded maps showing changes or differences in cortical parameters on the bone surface or BMD values in the volume. In these cases, each vertex or voxel represents an individual statistical test, with significance often determined by a simple t-test at each point [9, 10, 11, 12, 13, 28, 52, 54, 55]. This approach highlights seemingly significant regions in the color-coded maps, creating the illusion of localized changes or differences where there are none. When presenting changes or differences in the volume through color-coded cross-sectional views, the statistical significance at the voxel level is generally not provided at all [9, 11, 30, 52, 54, 55, 56]. In the same way this suggests real changes when, in fact, they may simply be a result of random variation. Consequently, these color-coded maps can give an overly optimistic impression of the impact of treatments or interventions, falsely suggesting efficacy where there may be none.
The issue of false positives due to inadequate multiple comparison corrections has been a persistent challenge in the field of neuroimaging [57]. To address this, the neuroimaging community has developed solutions that can also be applied to studies examining cortical bone changes on the bone surface and density changes in the voxels of QCT scans. Poole et al. [58] describe how SurfStat (http://math.mccgill.ca/keith/surfstat/) can be used to test whether differences in the cortical parameters at each point on the bone surface were statistically significant, with random field theory applied for multiple comparison correction. Similar packages exist for voxel-based analysis, such as the Statistical Parametric Mapping library (https://www.fil.ion.ucl.ac.uk/spm/) and the FMRIB Software Library (https://fsl.fmrib.ox.ac.uk). The use of these tools would improve the statistical rigor of studies using 3D-DXA, although the observed changes or differences would still predominantly reflect the correlation of all parameters with aBMD.
Implications
The use of 3D-DXA has wide-reaching implications in both research and clinical practice. The following sections will delve into these challenges.Misleading results in drug efficacy studies
In most studies, the results of 3D-DXA align with what is expected in the cortex, as cortical parameters in healthy individuals are typically correlated with aBMD. This often leads to seemingly sensible results. However, this approach becomes flawed when the changes do not follow conventional patterns. The method is particularly problematic in drug trials where normal bone modeling and remodeling are altered, and the usual proportional increases or decreases in all parameters may not occur.An illustrative example is a study on teriparatide, where 3D-DXA indicated an increase in all cortical parameters, including a significant increase in cortical vBMD compared to placebo [52]. In contrast, using an equivalent cortical measurement technique applied to QCT, cortical BMD was shown to significantly decrease following the same 18-month teriparatide treatment, which was seen consistently in data from three different clinical trials [41]. This decrease is attributed to an increased rate of remodeling, which results in greater cortical porosity, as also observed using micro-CT [59].
In an earlier study, 3D-Shaper Medical did report a decrease in cortical BMD in response to teriparatide [15]. Although this was noted by the authors as a decrease, the change was not statistically significant. A more recent independent study also found no significant changes in cortical BMD in response to teriparatide treatment using a 3D-DXA analysis [60]. It may be possible that there is some influence from the cortex of the shaft, which is partly visible in the DXA image. Due to the nature of 3D-DXA, an aBMD decrease in this region, might have been projected across the entire femur model, including areas where no cortex is visible, since the model parameters influence the density distribution globally. However, this did not lead to the correct significant decrease in cortical BMD observed in QCT studies.
The study that reported an increase in all cortical parameters with teriparatide (TPTD) also evaluated abaloparatide in parallel, showing an even greater increase in all parameters for the latter [52]. Follow-up studies using 3D-DXA analysis also reported significant increases in cortical BMD after abaloparatide treatment [55, 56]. Given that abaloparatide shares a similar mechanism of action with TPTD, increasing the rate of bone remodeling, one would reasonably expect it to also lead to a decrease in cortical BMD. In fact, a study using QCT observed a decrease in cortical BMD following a similar period of abaloparatide treatment in 35 patients [61], although the reduction was not statistically significant. This suggests that the 3D-DXA studies not only produced inaccurate changes but also likely resulted in an overly favorable assessment of abaloparatide’s effects.
A study by Lewiecki et al. [54] further illustrates the limitations of 3D-DXA in measuring discordant cortical changes. Their 3D-DXA analysis reported increases in all cortical parameters in response to romosozumab. In contrast, a previous QCT analysis found no increase in cortical BMD following the same treatment [62]. The authors noted: “It is unclear why data obtained by QCT and DXA-based 3D-SHAPER for romosozumab treatment on hip integral and trabecular vBMD were similar across the studies but differed for cortical vBMD.” Given that the letter to the editor of Bone seen by some of the same authors had already explained and predicted this discrepancy [7], it appears that there persists a misunderstanding regarding the capabilities and limitations of 3D-DXA. As a result, this misunderstanding has likely again led to an overly optimistic assessment of the drug's efficacy.
These studies further disseminate potentially incorrect results by presenting color maps of cortical and trabecular bone changes. 3D-DXA cannot measure localized or focal changes, partly because each model parameter affects the density distribution globally, and also because these changes are not visible on a DXA image. The failure to apply multiple comparison corrections in these studies further undermines the results, as the seemingly significant regions in the maps are, in fact, much less significant, leading to an overly optimistic assessment of various drugs.
Patient management
While the 3D-Shaper software can produce 71 measures, the clinically approved version produces only the global trabecular vBMD and cortical sBMD as well as an associated T-score and Z-score. It is not clear from what population the T- and Z-score are derived, although in a webinar by 3D-Shaper Medical a Caucasian reference data is noted [63]. Reference plots have previously been produced for a Spanish [64] and Argentinian [65] population, which are both reproduced in Figure 6. These plots, however, appear distinct from each other and from the figures produced by the 3D-Shaper software. 3D-Shaper Medical, DMS Imaging and their distributors do not disclose this population, or how these data have been derived. However, it is confirmed by Toyo Medic Co., Ltd. (Tokyo, Japan), the distributor of 3D-Shaper in Japan, that the 3D-Shaper software approved for the Japanese market does not use reference data from a Japanese population. Considering the large difference in cortical and trabecular parameters between Caucasian and Asian populations [17], applying these T- and Z-scores in Japan does not seem prudent without further validation. Their validity should also be confirmed for every population in which they are applied.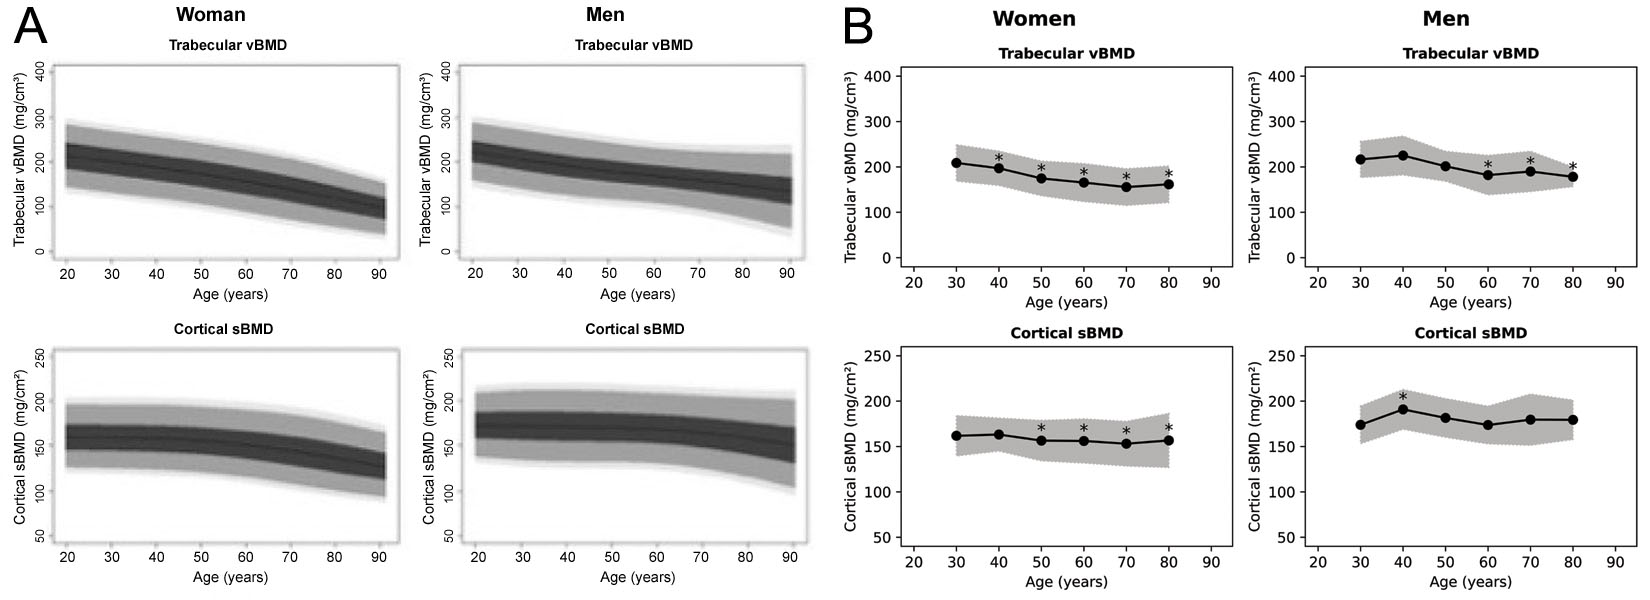
In a webinar [66] 3D-Shaper Medical suggested a potential clinical use where 3D-Shaper resulted in a low cortical sBMD and very low trabecular vBMD. Since teriparatide, according to the table, improves the trabecular bone more than the cortical bone, teriparatide was said to be the best treatment. However, based on this table, a clinician would naturally choose Denosumab or Abaloparatide over teribaratide if neglecting the vertebral aBMD.
3D-DXA will likely only be used alongside regular DXA T-score and Z-score assessments. Thus, the danger of missing a high risk individual will be minimum. However, due to the error associated with 3D-DXA, the cortical sBMD and trabecular vBMD will always be slightly higher or lower. In patients on the border of treatment this may sway the clinician to give anti-osteoporosis drugs where this would not be indicated by aBMD alone.
A study on Trabecular Bone Score (TBS) shows that this additional assessment significantly influences treatment decisions in secondary osteoporosis [67]. In that study, 21–25.5% of patients with unremarkable BMD measurements had poor bone quality indicated by TBS, which changed the treatment decision. A similar effect could occur with 3D-DXA, potentially leading to unintended consequences, such as overprescription. If the table was used, this may also sway the clinician to choose one drug over the other.
It is also stated by 3D-Shaper Medical that patients can be monitored to determine whether the selected treatment does indeed have the expected effect on the cortex and trabecular compartment. However, considering that errors of 3D-DXA are greater than expected changes, and that repeatability is low [36], it cannot be ascertained whether changes seen in a follow-up 3D-DXA assessment are due to real effects or merely the inherent error of 3D-DXA. If a clinician trusts these results, they may be swayed to unnecessarily change the treatment.
(A)
| 2D DXA (Total hip) aBMD | 3D-DXA (3D-Shaper) Trabecular vBMD | 3D-DXA (3D-Shaper) Cortical sBMD | |
|---|---|---|---|
| Alendronate | + | + | + |
| Denosumab | ++ | ++ | ++ |
| Zoledronic acid | + | + | ++ |
| Teriparatide [15, 52, 55*, 56] | + | ++ | = |
| Abaloparatide | ++ | ++ | ++ |
| Romosozumab | +++ | +++ | +++ |
(B)
| aBMD | vBMD | sBMD | |
|---|---|---|---|
| Teriparatide [52, 56] (18 months) | ++ (3.3%) | ++/+++ (9%) | + (1.8%) |
| Teriparatide [15] (24 months) | = (p > 0.05) | ++/+++ (5.9%) | = (p > 0.05) |
| Teriparatide [60] (24 months) | = (p > 0.05) | ++/+++ (>14%) | = (p > 0.05) |
(C)
| Symbol | (Total hip) aBMD | Trabecular vBMD | Cortical sBMD |
|---|---|---|---|
| +++ | Δ > n/a % | Δ > n/a % | Δ > n/a % |
| ++ | 2 < Δ ≤ n/a % | 4 < Δ ≤ n/a % | 2 < Δ ≤ n/a % |
| + | 0.5 < Δ ≤ 2 % | 0.5 < Δ ≤ 4 % | 0.5 < Δ ≤ 2 % |
| = | -0.5 ≤ Δ ≤ 0.5 % | -0.5 ≤ Δ ≤ 0.5 % | -0.5 ≤ Δ ≤ 0.5 % |
| - | -2 ≤ Δ < -0.5 % | -4 ≤ Δ < -0.5 % | -2 ≤ Δ < -0.5 % |
| -- | Δ < -2 % | Δ < -4 % | Δ < -2 % |
Although the clinical version of 3D-DXA does not provide information about the cortical sBMD in the various anatomical regions, it does display a color coded 3D model of the sBMD across the bone surface. 3D-Shaper Medical subsequently suggests this can be used to detect local fragility [66]. Unfortunately, 3D-DXA cannot reconstruct the patient specific cortical map. I will refer again for Figure 2 for an intuitive explanation for this. Thus, if a 3D-DXA cortical map suggests local deficiencies, these may be statistically plausible outputs of the model, but do not correspond to the patient's actual anatomy. This again may lead to an unnecessary or inappropriate treatment decision.
The 3D-Shaper software has now also received FDA clearance through the 510(k) premarket notification process [68]. 3D-Shaper Medical obtained this using a correlation study comparing the cross-sectional area (CSA), cross-sectional moment of inertia (CSMI), section modulus (Z), Buckling Ratio (BR), cortical surface bone mineral density (sBMD), trabecular volumetric bone mineral density (vBMD) and integral vBMD to similar measurements from the Hip Structural Analysis (HSA) software by Hologic Inc., which had previously received FDA clearance.
Notably, the neck axis length and neck shaft angle have remained absent from this evaluation, and thus the use of these parameters is not cleared by the FDA. It should be noted that The International Society for Clinical Densitometry (ISCD) guidelines recommend that HSA parameters should not be used to assess risk of hip fracture, with the exception of hip axis length [69]. Furthermore, this regulatory approval does not include a T-score or Z-score to compare the measurements with reference data. This raises concerns about the clinical applicability of 3D-Shaper in the United States.
Finally, 3D-Shaper parameters were considered to be substantially equivalent to the HSA option for the Hologic QDR X-ray Bone Densitometers. The FDA is not able to confirm whether 3D-Shaper can be used with other DXA scanners, leaving the question of compatibility with other devices in the United States unresolved.
Discussion
In summary, 3D-DXA produces a variety of bone parameters that appear highly detailed, but primarily reflect overall areal BMD rather than measuring distinct cortical or trabecular properties. While the software may yield results that correlate with true values in populations where cortical and trabecular changes are proportional to aBMD, it falls short in capturing patient-specific measurements or localized changes. This limitation is especially pronounced in scenarios such as anabolic therapy, where cortical and trabecular bone parameters may change inversely and 3D-DXA fails to reflect these true changes observed by QCT. This raises significant concerns for its use in routine clinical care or as a reliable research tool.3D-DXA was initially developed to better diagnose osteoporosis by providing an estimate of the integral vBMD [70, 71]. By not attempting to separately assess the cortical and trabecular compartments, the integral vBMD produced by 3D-DXA may still represent a valid estimation. The methodology was later extended to attempt to improve fracture risk estimations by analyzing the model parameters directly, since these parameters fully describe the morphology of the statistical model [51, 72, 73, 74]. However, the key limitations of 3D-DXA, as detailed in this review, remain and undermine its accuracy and reliability.
This study was limited by the lack of transparency from the companies commercializing 3D-DXA, including 3D-Shaper Medical, DMS Imaging, and Fujifilm. As a result, it relies on publicly available information and my own experience in developing this methodology. I encourage readers to seek clarifications from these companies or their representatives regarding aspects of 3D-DXA and 3D-Shaper that have not been disclosed.
Evaluations from professional societies could provide valuable guidance by providing independent assessments of the validity of 3D-DXA and establishing official recommendations regarding its use. Although an update on the practice guideline for dual-energy X-ray absorptiometry by the International Working Group on DXA Best Practices states regarding 3D-DXA that "more evidence is needed to make recommendations for the application of these novel imaging techniques in clinical practice" [75], I believe there is now sufficient evidence to base a recommendation on, and I hope this review will be helpful in that regard.
In conclusion, given the fundamental limitations of 3D-DXA, it is my professional assessment that the cortical and trabecular parameters provided by 3D-DXA should not be used for research purposes, nor are they suitable for clinical applications such as diagnosis, monitoring, or treatment decision support.
Author contributions
TW contributed to the conceptualization, data curation, formal analysis, investigation, methodology, resources, visualization, and writing of the manuscript.Funding
No funding was received for this study.Data availability
All data presented in this article are available from the author upon request.Conflicts of interest
The author is the co-inventor of a patent related to the methodology underlying the 3D-DXA software. The author has been involved in discussions regarding the intellectual property and origins of the commercial 3D-DXA software code, statistical models, and promotional material. The author is not affiliated with 3D-Shaper Medical or other companies involved in the commercial exploitation of 3D-DXA and has not received equity, royalties, or other financial compensation. The author has lectured for UCB in educational fora and received research grant support from Amgen Inc. and Lilly. The views expressed in this article are solely those of the author and are based on a critical evaluation of the methodology and available scientific evidence.References
- Whitmarsh T (2012). 3D Reconstruction of the Proximal Femur and Lumbar Vertebrae from Dual-Energy X-Ray Absorptiometry for Osteoporotic Risk Assessment
- Humbert L, Martelli Y, Fonolla R, et al. (2017). 3D-DXA: Assessing the Femoral Shape, the Trabecular Macrostructure and the Cortex in 3D from DXA images. IEEE Transactions on Medical Imaging, 36(1), 27–39.
- Whitmarsh T, Humbert L, De Craene M, et al. (2011). Reconstructing the 3D Shape and Bone Mineral Density Distribution of the Proximal Femur From Dual-Energy X-Ray Absorptiometry. IEEE Transactions on Medical Imaging, 30(12), 2101–2114.
- Ahmad O, Ramamurthi K, Wilson KE, et al. (2010). Volumetric DXA (VXA): A new method to extract 3D information from multiple in vivo DXA images. Journal of Bone and Mineral Research, 25(12), 2744–2751.
- Väänänen SP, Grassi L, Flivik G, et al. (2015). Generation of 3D shape, density, cortical thickness and finite element mesh of proximal femur from a DXA image. Medical Image Analysis, 24(1), 125–134.
- Whitmarsh T, Humbert L, De Craene M, et al. 3D bone mineral density distribution and shape reconstruction of the proximal femur from a single simulated DXA image: an in vitro study. In: Dawant BM, Haynor DR, eds. Medical Imaging 2010: Image Processing. Vol. 7623. SPIE; 2010:76234U.
- Whitmarsh T. Concerns regarding the use of 3D-DXA. Bone. 2021;149:115939.
- Treece G, Gee A (2015). Independent measurement of femoral cortical thickness and cortical bone density using clinical CT. Medical Image Analysis, 20(1), 249–264.
- Freitas L, Amorim T, Humbert L, et al. (2018). Cortical and trabecular bone analysis of professional dancers using 3D-DXA: a case–control study. Journal of Sports Sciences, 37(1), 82–89.
- Gracia-Marco L, García-Fontana B, Ubago-Guisado E, et al. (2019). Analysis of Bone Impairment by 3D DXA Hip Measures in Patients With Primary Hyperparathyroidism: A Pilot Study. The Journal of Clinical Endocrinology \& Metabolism, 105(1), 175–184.
- Orduna G, Humbert L, Fonolla R, et al. (2018). Cortical and Trabecular Bone Analysis of Patients With High Bone Mass From the Barcelona Osteoporosis Cohort Using 3-Dimensional Dual-Energy X-ray Absorptiometry: A Case-Control Study. Journal of Clinical Densitometry, 21(4), 480–484.
- Gifre L, Humbert L, Muxi A, et al. (2017). Analysis of the evolution of cortical and trabecular bone compartments in the proximal femur after spinal cord injury by 3D-DXA. Osteoporosis International, 29(1), 201–209.
- García Hoyos M, Humbert L, Salmón Z, et al. (2019). Analysis of volumetric BMD in people with Down syndrome using DXA-based 3D modeling. Archives of Osteoporosis, 14(1).
- Beck B, Harding A, Weeks B, et al. (2021). Response to “Concerns regarding the use of 3D-DXA”. Bone, 149, 115936.
- Winzenrieth R, Humbert L, Di Gregorio S, Bonel E, García M, Del Rio L. Effects of osteoporosis drug treatments on cortical and trabecular bone in the femur using DXA-based 3D modeling. Osteoporos Int.2018;29(10):2323–2333.
- Cummings SR, Cauley JA, Palermo L, et al. Racial differences in hip axis lengths might explain racial differences in rates of hip fracture. Osteoporos Int.1994;4(4):226–229.
- Kim KM, Brown JK, Kim KJ, et al. Differences in femoral neck geometry associated with age and ethnicity. Osteoporos Int. 2010;22(7):2165–2174.
- Sone T, Humbert L, Lopez M, et al. (2022). Assessment of femoral shape, trabecular and cortical bone in Japanese subjects using DXA-based 3D modelling. JOURNAL OF BONE AND MINERAL RESEARCH, 37, 214--214.
- Varoquaux G, Cheplygina V (2022). Machine learning for medical imaging: methodological failures and recommendations for the future. npj Digital Medicine, 5(1).
- Hadjiiski L, Cha K, Chan H, et al. (2023). AAPM task group report 273: Recommendations on best practices for AI and machine learning for computer‐aided diagnosis in medical imaging. Medical Physics, 50(2).
- Huisman M (2024). When AUC-ROC and accuracy are not accurate: what everyone needs to know about evaluating artificial intelligence in radiology. European Radiology, 34(12), 7892–7894.
- Gallifant J, Bitterman DS, Celi LA, et al. (2024). Ethical debates amidst flawed healthcare artificial intelligence metrics. npj Digital Medicine, 7(1).
- Amani A, Bellver M, del Rio L, et al. (2022). Femur 3D-DXA Assessment in Female Football Players, Swimmers, and Sedentary Controls. International Journal of Sports Medicine, 44(06), 420–426.
- Maïmoun L, Renard E, Humbert L, et al. (2021). Modification of bone mineral density, bone geometry and volumetric BMD in young women with obesity. Bone, 150, 116005.
- Jain RK, López Picazo M, Humbert L, et al. (2025). Bone Structural Parameters as Measured by 3-Dimensional Dual-Energy X-Ray Absorptiometry Are Superior in Black Women and Demonstrate Unique Associations With Prior Fracture Versus White Women. Endocrine Practice, 31(2), 152–158.
- Gracia-Marco L, Gonzalez-Salvatierra S, Garcia-Martin A, et al. (2021). 3D DXA Hip Differences in Patients with Acromegaly or Adult Growth Hormone Deficiency. Journal of Clinical Medicine, 10(4), 657.
- Toussirot E, Winzenrieth R, Aubin F, et al. (2024). Areal bone mineral density, trabecular bone score and 3D-DXA analysis of proximal femur in psoriatic disease. Frontiers in Medicine, 11.
- Ubago-Guisado E, Moratalla-Aranda E, González-Salvatierra S, et al. (2023). Do patients with type 2 diabetes have impaired hip bone microstructure? A study using 3D modeling of hip dual-energy X-ray absorptiometry. Frontiers in Endocrinology, 13.
- Guerra FS, Palladino N, Winzenrieth R, et al. (2024). Advanced 3D-DXA insights into bone density changes in hyperparathyroidism. Journal of Diabetes \& Metabolic Disorders, 23(2), 2191–2199.
- Kužma M, Vaňuga P, Ságová I, et al. Non-invasive DXA derived bone structure assessment of acromegaly patients: a cross sectional study. Eur J Endocrinol. 2019;180(3):201–211.
- Maïmoun L, Aouinti S, Puech M, et al. Modification of bone architecture following sleeve gastrectomy: a five-year follow-up. J Bone Miner Res. 2024;40(2):251–261.
- Maïmoun L, Gelis A, Serrand C, et al. (2023). Alteration of Volumetric Bone Mineral Density Parameters in Men with Spinal Cord Injury. Calcified Tissue International, 113(3), 304–316.
- Harding AT, Weeks BK, Lambert C, et al. (2020). Effects of supervised high-intensity resistance and impact training or machine-based isometric training on regional bone geometry and strength in middle-aged and older men with low bone mass: The LIFTMOR-M semi-randomised controlled trial. Bone, 136, 115362.
- Gil-Cosano JJ, Ubago-Guisado E, Sánchez MJ, et al. (2020). The effect of an online exercise programme on bone health in paediatric cancer survivors (iBoneFIT): study protocol of a multi-centre randomized controlled trial. BMC Public Health, 20(1).
- Humbert L, Whitmarsh T, De Craene M, et al. (2010). 3D reconstruction of both shape and Bone Mineral Density distribution of the femur from DXA images. 2010 IEEE International Symposium on Biomedical Imaging: From Nano to Macro, 456–459.
- O’Rourke D, Beck BR, Harding AT, et al. (2021). Assessment of femoral neck strength and bone mineral density changes following exercise using 3D-DXA images. Journal of Biomechanics, 119, 110315.
- Dudle A, Gugler Y, Pretterklieber M, et al. (2023). 2D-3D reconstruction of the proximal femur from DXA scans: Evaluation of the 3D-Shaper software. Frontiers in Bioengineering and Biotechnology, 11.
- Clotet J, Martelli Y, Di Gregorio S, et al. (2018). Structural Parameters of the Proximal Femur by 3-Dimensional Dual-Energy X-ray Absorptiometry Software: Comparison With Quantitative Computed Tomography. Journal of Clinical Densitometry, 21(4), 550–562.
- Ramamurthi K, Ahmad O, Engelke K, et al. (2011). An in vivo comparison of hip structure analysis (HSA) with measurements obtained by QCT. Osteoporosis International, 23(2), 543–551.
- Whitmarsh T, Treece GM, Gee AH, et al. (2015). Mapping Bone Changes at the Proximal Femoral Cortex of Postmenopausal Women in Response to Alendronate and Teriparatide Alone, Combined or Sequentially. Journal of Bone and Mineral Research, 30(7), 1309–1318.
- Whitmarsh T, Treece GM, Gee AH, et al. (2016). The Effects on the Femoral Cortex of a 24 Month Treatment Compared to an 18 Month Treatment with Teriparatide: A Multi-Trial Retrospective Analysis. PLOS ONE, 11(2), e0147722.
- Huininga K, Koromani F, Zillikens M, et al. (2024). Use of 3D Shaper Analysis for the Assessment of Fracture Risk in a Population-Based Setting. JBMR Plus, 8(Supplement\_1), i1--i340.
- Huininga K, Koromani F, Zillikens MC, et al. (2024). Use of 3D Shaper Analysis for the Assessment of Fracture Risk in a Population-based Setting. ASBMR 2024 Annual Meeting Abstracts and Abstract Book.
- Qasim M, López Picazo M, Ruiz Wills C, et al. (2024). 3D-DXA Based Finite Element Modelling for Femur Strength Prediction: Evaluation Against QCT. Journal of Clinical Densitometry, 27(2), 101471.
- Iki M, Winzenrieth R, Tamaki J, et al. (2021). Predictive ability of novel volumetric and geometric indices derived from dual-energy X-ray absorptiometric images of the proximal femur for hip fracture compared with conventional areal bone mineral density: the Japanese Population-based Osteoporosis (JPOS) Cohort Study. Osteoporosis International, 32(11), 2289–2299.
- Grassi L, Väänänen SP, Ristinmaa M, et al. Prediction of femoral strength using 3D finite element models reconstructed from DXA images: validation against experiments. Biomechanics and Modeling in Mechanobiology, 16(3).
- Grassi L, Fleps I, Sahlstedt H, et al. (). Validation of 3D finite element models from simulated DXA images for biofidelic simulations of sideways fall impact to the hip. Bone, 142.
- Grassi L, Väänänen SP, Jehpsson L, et al. (). 3D Finite Element Models Reconstructed From 2D Dual‐Energy X‐Ray Absorptiometry (DXA) Images Improve Hip Fracture Prediction Compared to Areal BMD in Osteoporotic Fractures in Men (MrOS) Sweden Cohort. Journal of Bone and Mineral Research, 38(9).
- Grassi L, Väänänen SP, Voss A, et al. DXA-based 3D finite element models predict hip fractures better than areal BMD in elderly women. Bone. 2025;195:117457.
- Allison SJ, Poole KES, Treece GM, et al. (2015). The Influence of High-Impact Exercise on Cortical and Trabecular Bone Mineral Content and 3D Distribution Across the Proximal Femur in Older Men: A Randomized Controlled Unilateral Intervention. Journal of Bone and Mineral Research, 30(9), 1709–1716.
- Whitmarsh T, Fritscher KD, Humbert L, et al. (2011). Hip fracture discrimination using 3D reconstructions from Dual-energy X-ray Absorptiometry. 2011 IEEE International Symposium on Biomedical Imaging: From Nano to Macro, 1189–1192.
- Winzenrieth R, Ominsky M, Wang Y, et al. (2021). Differential effects of abaloparatide and teriparatide on hip cortical volumetric BMD by DXA-based 3D modeling. Osteoporosis International, 32(3), 575–583.
- England JR, Cheng PM (2019). Artificial Intelligence for Medical Image Analysis: A Guide for Authors and Reviewers. American Journal of Roentgenology, 212(3), 513–519.
- Lewiecki EM, Betah D, Humbert L, et al. (2024). 3D-modeling from hip DXA shows improved bone structure with romosozumab followed by denosumab or alendronate. Journal of Bone and Mineral Research, 39(4), 473–483.
- Winzenrieth R, Kostenuik P, Boxberger J, et al. (2022). Proximal Femur Responses to Sequential Therapy With Abaloparatide Followed by Alendronate in Postmenopausal Women With Osteoporosis by 3D Modeling of Hip Dual‐Energy X‐Ray Absorptiometry (DXA). JBMR Plus, 6(4).
- Winzenrieth R, Humbert L, Boxberger JI, et al. (2022). Abaloparatide Effects on Cortical Volumetric BMD and Estimated Strength Indices of Hip Subregions by 3D-DXA in Women With Postmenopausal Osteoporosis. Journal of Clinical Densitometry, 25(3), 392–400.
- Bennett C, Miller M, Wolford G (2009). Neural correlates of interspecies perspective taking in the post-mortem Atlantic Salmon: an argument for multiple comparisons correction. NeuroImage, 47, S125.
- Poole KE, Treece GM, Gee AH, et al. (2014). Denosumab Rapidly Increases Cortical Bone in Key Locations of the Femur: A 3D Bone Mapping Study in Women With Osteoporosis. Journal of Bone and Mineral Research, 30(1), 46–54.
- Sato M, Westmore M, Ma YL, et al. (2004). Teriparatide [PTH(1–34)] Strengthens the Proximal Femur of Ovariectomized Nonhuman Primates Despite Increasing Porosity. Journal of Bone and Mineral Research, 19(4), 623–629.
- Hadji P, Kamali L, Thomasius F, et al. (2024). Real-world efficacy of a teriparatide biosimilar (RGB-10) compared with reference teriparatide on bone mineral density, trabecular bone score, and bone parameters assessed using quantitative ultrasound, 3D-SHAPER® and high-resolution peripheral computer tomography in postmenopausal women with osteoporosis and very high fracture risk. Osteoporosis International, 35(12), 2107–2116.
- Sone T, Ohnaru K, Sugai T, et al. (2023). The effects of abaloparatide on hip geometry and biomechanical properties in Japanese osteoporotic patients assessed using DXA-based hip structural analysis: results of the Japanese phase 3 ACTIVE-J trial. Archives of Osteoporosis, 18(1).
- Genant HK, Engelke K, Bolognese MA, et al. (2016). Effects of Romosozumab Compared With Teriparatide on Bone Density and Mass at the Spine and Hip in Postmenopausal Women With Low Bone Mass. Journal of Bone and Mineral Research, 32(1), 181–187.
- MEDICAL 3S (2021). Webinar - Use of 3D-Shaper in clinical research: state of the art and potential applications
- Casado Burgos E, Di Gregorio S, González Macías J, et al. (2019). Datos de referencia de mediciones óseas en modelos 3D de fémur proximal en población española cn DXA: Proyecto SEIOMM 3D-SHAPPER. Congreso SEIOMM (24º : 2019 : Gerona).
- Brance ML, Saravi FD, Henr{\'i}quez MM, et al. (2020). Reference Values of Three-Dimensional Proximal Femur Parameters from Bone Densitometry Images in Healthy Subjects from Argentina. World Congress on Osteoporosis, Osteoarthritis and Musculoskeletal Diseases, 372--372.
- Jennings I (2023). 3D Shaper Technology: Revolutionizing Bone Health Analysis
- Al-Hashimi L, Klotsche J, Ohrndorf S, et al. (2023). Trabecular Bone Score Significantly Influences Treatment Decisions in Secondary Osteoporosis. Journal of Clinical Medicine, 12(12), 4147.
- Food {, Administration} D (2022). 510(k) Summary: K220822
- Broy SB, Cauley JA, Lewiecki ME, et al. (2015). Fracture Risk Prediction by Non-BMD DXA Measures: the 2015 ISCD Official Positions Part 1: Hip Geometry. Journal of Clinical Densitometry, 18(3), 287–308.
- Whitmarsh T, Humbert L, Craene MD, et al. (2009). Reconstrucción de la forma del fémur y densidad mineral ósea en 3D para el diagnóstico de osteoporosis a partir de DXA
- Whitmarsh T, Humbert L, Del Río Barquero LM, et al. (2011). Volumetric Bone Mineral Density Estimation using a 3D Reconstruction Method from Dual-energy X-ray Absorptiometry. ASBMR 2011 Annual Meeting Abstracts and Abstract Book.
- Whitmarsh T, Fritscher KD, Humbert L, et al. (2011). A Statistical Model of Shape and Bone Mineral Density Distribution of the Proximal Femur for Fracture Risk Assessment. Medical Image Computing and Computer-Assisted Intervention – MICCAI 2011, 393–400.
- Whitmarsh T, Fritscher KD, Humbert L, et al. (2012). Hip fracture discrimination from dual-energy X-ray absorptiometry by statistical model registration. Bone, 51(5), 896–901.
- Martelli Y, Whitmarsh T, Humbert L, et al. (2012). A software framework for 3D reconstruction and fracture risk assessment of the proximal femur from dual-energy x-ray absorptiometry. Proceedings of VPH 2012: Virtual Physiological Human - Integrative approaches to computational biomedicine.
- Slart RHJA, Punda M, Ali DS, et al. (2024). Updated practice guideline for dual-energy X-ray absorptiometry (DXA). European Journal of Nuclear Medicine and Molecular Imaging, 52(2), 539–563.